

Question: https://www.perdisco.com/resources/html/statsTables/tTable.html An education minister would like to know whether students at Gedrassi high school on average perform better at English or at Mathematics. Denoting by
https://www.perdisco.com/resources/html/statsTables/tTable.html
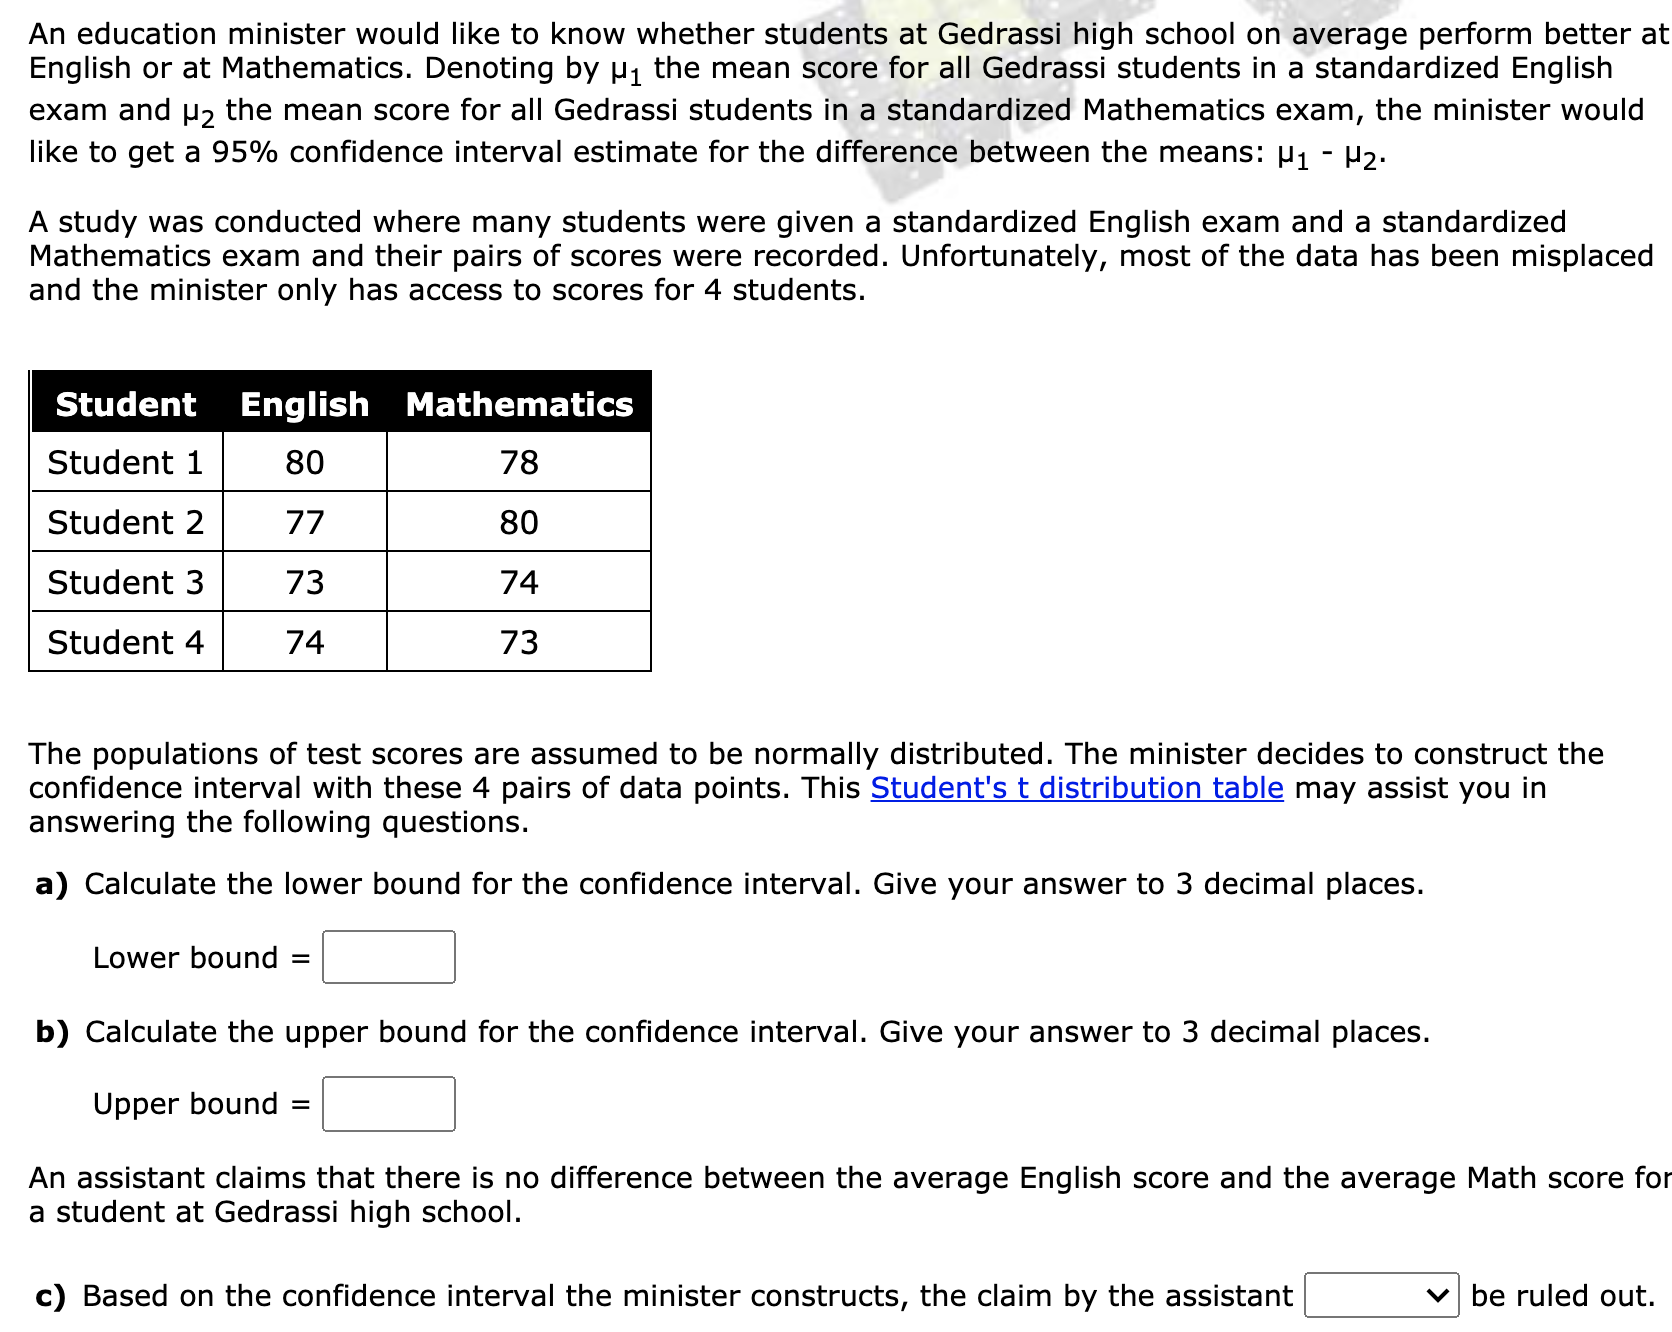
An education minister would like to know whether students at Gedrassi high school on average perform better at English or at Mathematics. Denoting by [.11 the mean score for all Gedrassi students in a standardized English exam and p2 the mean score for all Gedrassi students in a standardized Mathematics exam, the minister would like to get a 95% confidence interval estimate for the difference between the means: p1 - p2. A study was conducted where many students were given a standardized English exam and a standardized Mathematics exam and their pairs of scores were recorded. Unfortunately, most of the data has been misplaced and the minister only has access to scores for 4 students. Student English Mathematics The populations of test scores are assumed to be normally distributed. The minister decides to construct the condence interval with these 4 pairs of data points. This Student's t distribution table may assist you in answering the following questions. a) Calculate the lower bound for the confidence interval. Give your answer to 3 decimal places. Lower bound = :| b) Calculate the upper bound for the confidence interval. Give your answer to 3 decimal places. Upper bound = |:| An assistant claims that there is no difference between the average English score and the average Math score for a student at Gedrassi high school. c) Based on the confidence interval the minister constructs, the claim by the assistant be ruled out
Step by Step Solution
There are 3 Steps involved in it

Get step-by-step solutions from verified subject matter experts