

Question: https://www.perdisco.com/resources/html/statsTables/tTable.html The following table lists the weight of individuals before and after taking a diet prescribed by a weight-loss company for a month: Weight-loss Data
https://www.perdisco.com/resources/html/statsTables/tTable.html
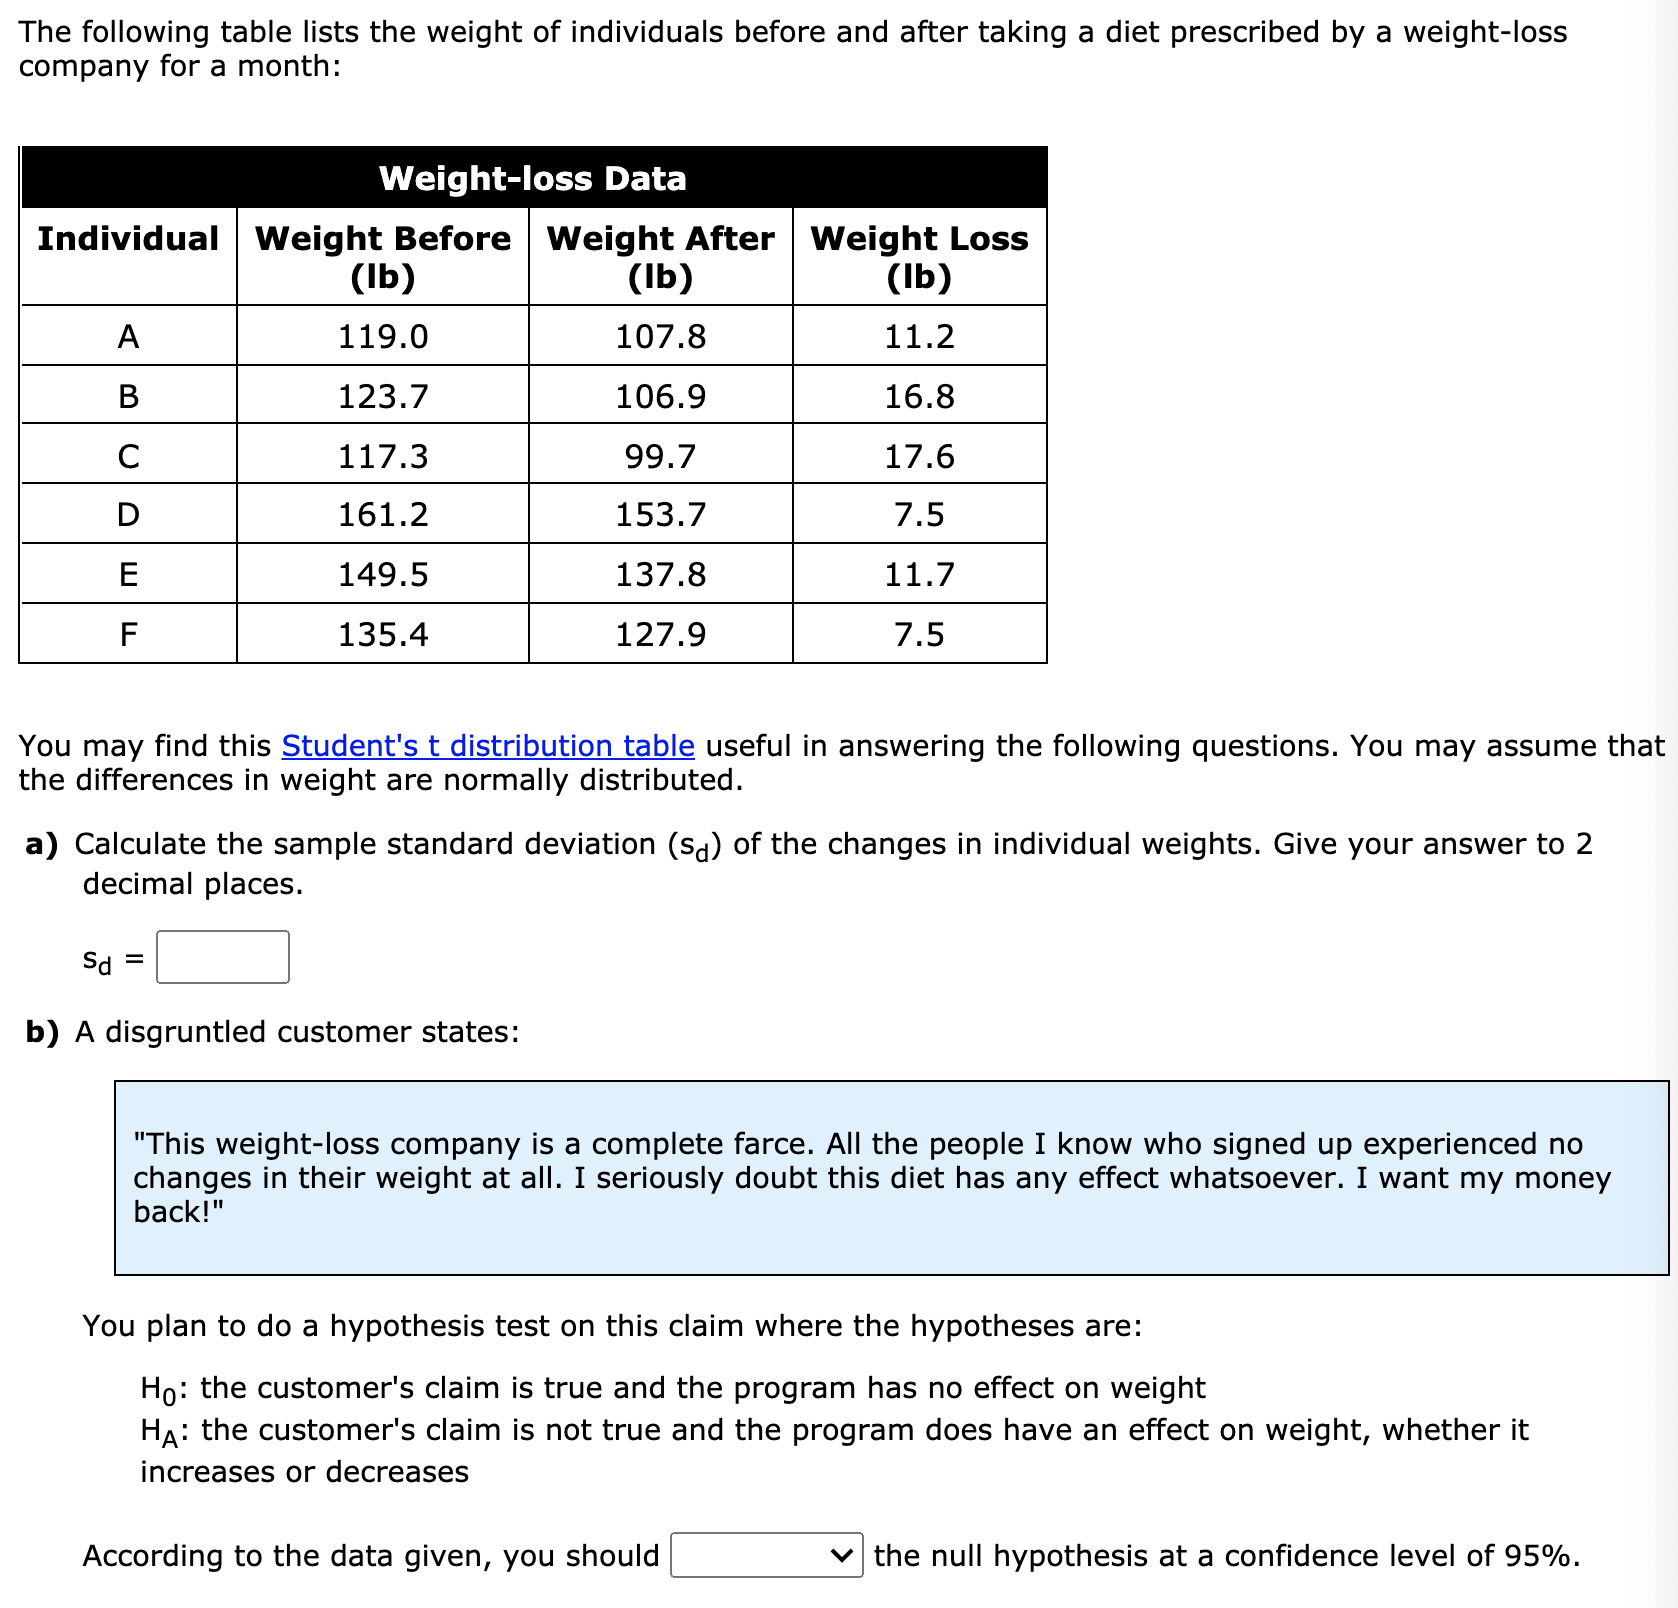
The following table lists the weight of individuals before and after taking a diet prescribed by a weight-loss company for a month: Weight-loss Data Individual Weight Before Weight After Weight Loss (lb) (lb) (lb) 123-7 106-9 117-3 17-6 161.2 153.7 7.5 149.5 137.8 11.7 You may find this Student's t distribution table useful in answering the following questions. You may assume that the differences in weight are normally distributed. a) Calculate the sample standard deviation (sd) of the changes in individual weights. Give your answer to 2 decimal places. b) A disgruntled customer states: "This weight-loss company is a complete farce. All the people I know who signed up experienced no changes in their weight at all. I seriously doubt this diet has any effect whatsoever. I want my money back!" You plan to do a hypothesis test on this claim where the hypotheses are: H0: the customer's claim is true and the program has no effect on weight HA: the customer's claim is not true and the program does have an effect on weight, whether it increases or decreases According to the data given, you should the null hypothesis at a confidence level of 95%
Step by Step Solution
There are 3 Steps involved in it

Get step-by-step solutions from verified subject matter experts