

Question: https://www.statcrunch.com/app/index.html?dataid=2734681# that is the link for the data that needs to be followed In this research study, respondents provided their Gender, GPA, Grade and where
https://www.statcrunch.com/app/index.html?dataid=2734681# that is the link for the data that needs to be followed
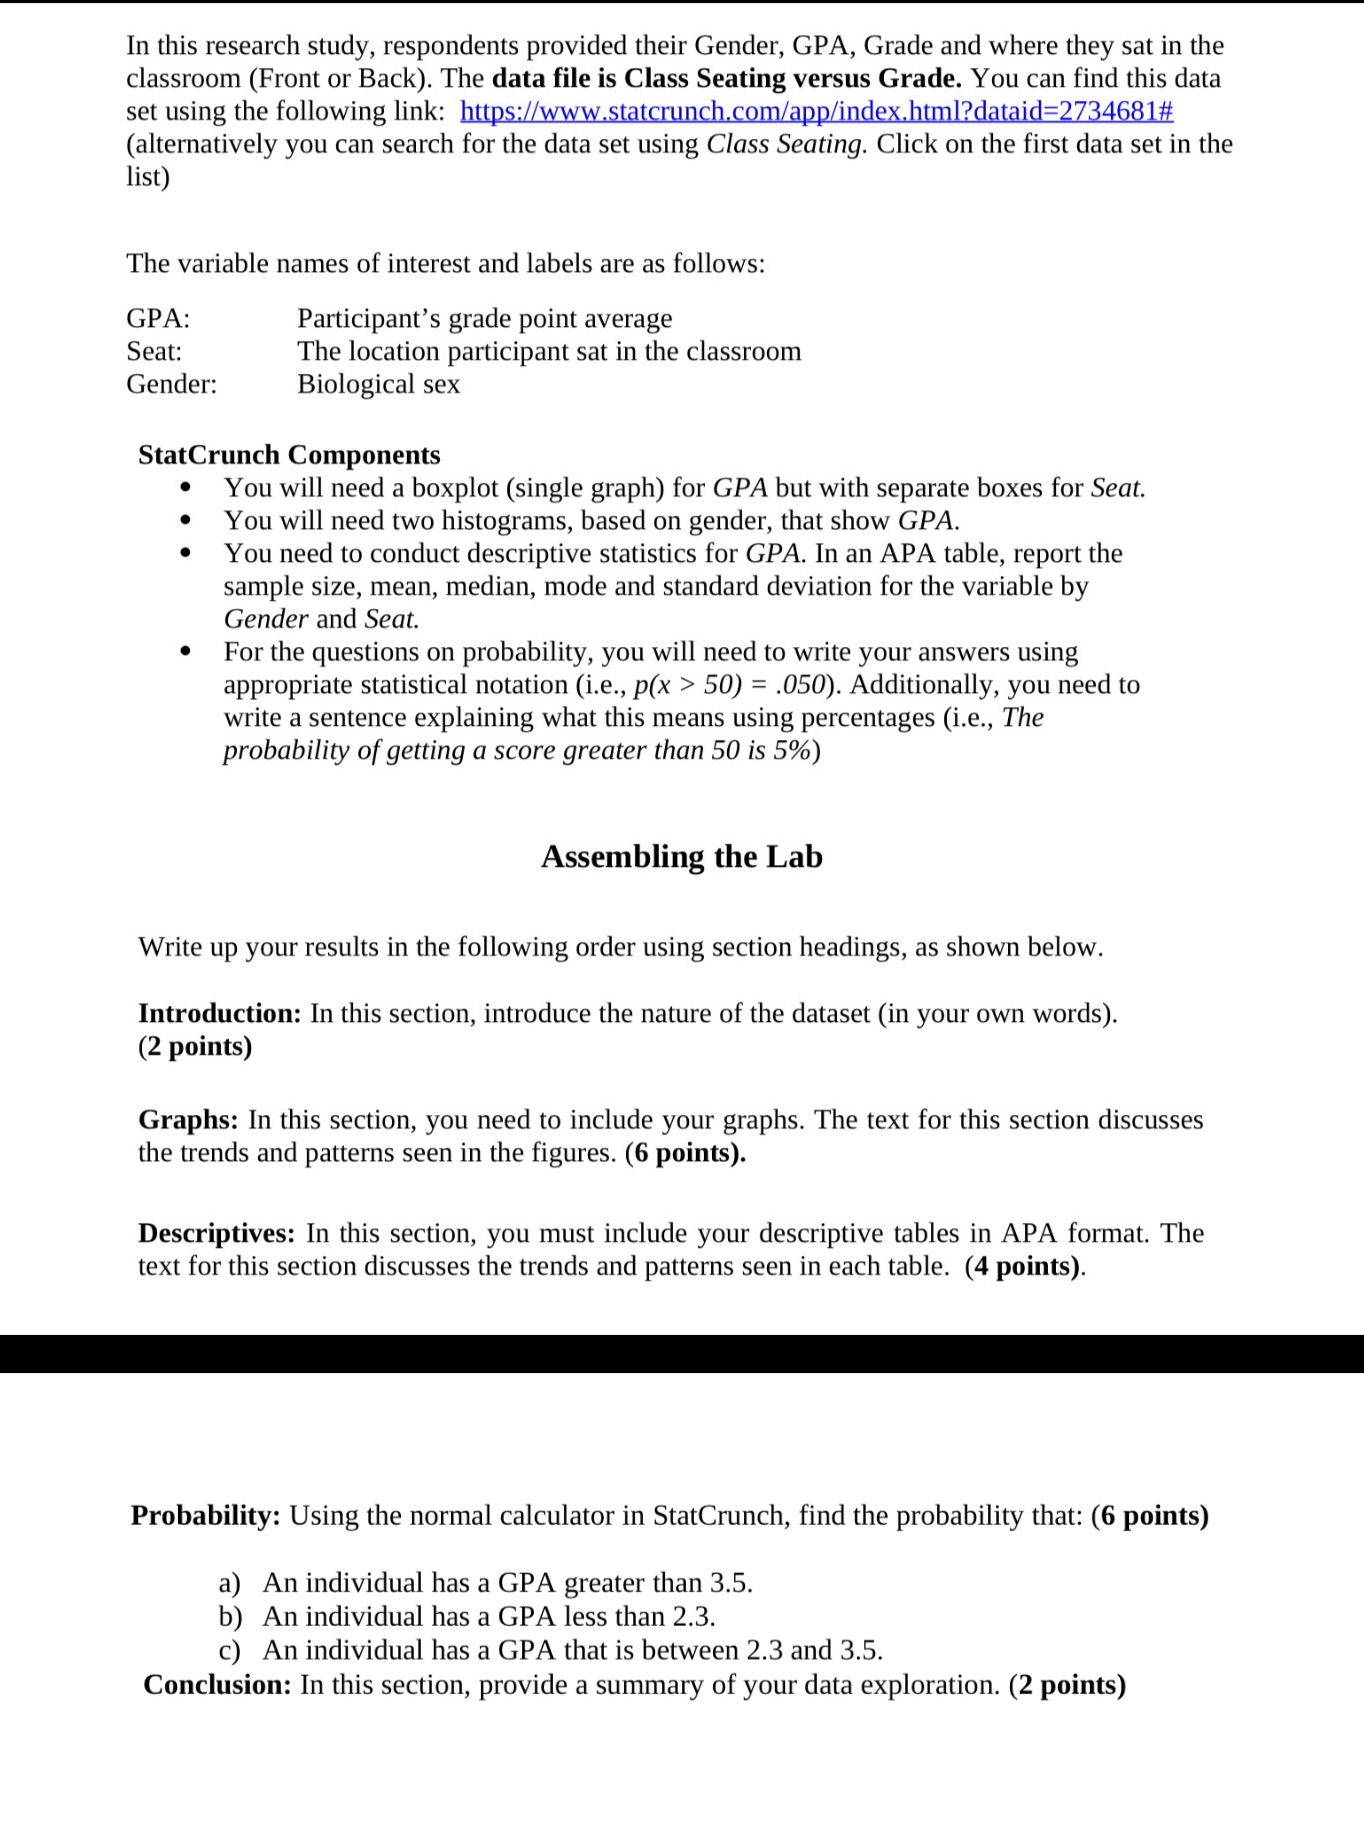
In this research study, respondents provided their Gender, GPA, Grade and where they sat in the classroom (Front or Back). The data file is Class Seating versus Grade. You can find this data set using the following link: : runch.com index.html?dataid=2734681# (alternatively you can search for the data set using Class Seating. Click on the first data set in the list) The variable names of interest and labels are as follows: GPA: Participant's grade point average Seat: The location participant sat in the classroom Gender: Biological sex StatCrunch Components * You will need a boxplot (single graph) for GPA but with separate boxes for Seat. * You will need two histograms, based on gender, that show GPA. * You need to conduct descriptive statistics for GPA. In an APA table, report the sample size, mean, median, mode and standard deviation for the variable by Gender and Seat. * For the questions on probability, you will need to write your answers using appropriate statistical notation (i.e., p(x > 50) = .050). Additionally, you need to write a sentence explaining what this means using percentages (i.e., The probability of getting a score greater than 50 is 5%) Assembling the Lab Write up your results in the following order using section headings, as shown below. Introduction: In this section, introduce the nature of the dataset (in your own words). (2 points) Graphs: In this section, you need to include your graphs. The text for this section discusses the trends and patterns seen in the figures. (6 points). Descriptives: In this section, you must include your descriptive tables in APA format. The text for this section discusses the trends and patterns seen in each table. (4 points). Probability: Using the normal calculator in StatCrunch, find the probability that: (6 points) a) An individual has a GPA greater than 3.5. b) An individual has a GPA less than 2.3. ) An individual has a GPA that is between 2.3 and 3.5. Conclusion: In this section, provide a summary of your data exploration. (2 points)
Step by Step Solution
There are 3 Steps involved in it

Get step-by-step solutions from verified subject matter experts