

Question: https://www.treasury.gov/resource-center/data-chart-center/interest-rates/Pages/Historic-Yield-Data-Visualization.aspx Dic Berner (Morgan Stanley) is a bit more skeptical about the predictive power of the yield curve. Does he just not understand Estrellas overwhelming
https://www.treasury.gov/resource-center/data-chart-center/interest-rates/Pages/Historic-Yield-Data-Visualization.aspx
Dic Berner (Morgan Stanley) is a bit more skeptical about the predictive power of the yield curve. Does he just not understand Estrellas overwhelming evidences, or does his skepticism rest on solid reasoning?
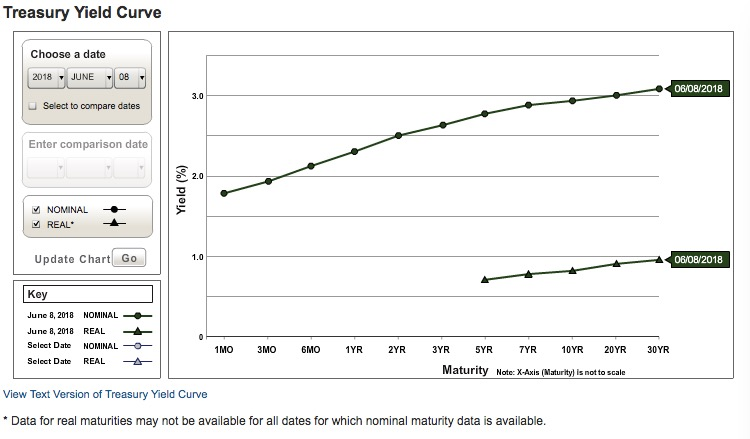
How is the U.S. yield curve currently sloped? What does it affect your forecast of economic activity?
Treasury Yield Curve Choose a date 2018 ? JUNE 08 06/08/2018 3.0 Select to compare dates Enter comparison date 2.0 REAL Update Chart Go 1.0 06/08/2018 Junc 8, 2018 NOMINAL Junc 8, 2018 REAL Select Date NOMINAL_ Select Date REAL -t- 1MO 3MO 6MO 1YR 2YR 3YR SYR TYR 10YR 20YR 30YR Maturity Note: X-Axis (Matrit is not to scale View Text Version of Treasury Yield Curve Data for real maturities may not be available for all dates for which nominal maturity data is available Treasury Yield Curve Choose a date 2018 ? JUNE 08 06/08/2018 3.0 Select to compare dates Enter comparison date 2.0 REAL Update Chart Go 1.0 06/08/2018 Junc 8, 2018 NOMINAL Junc 8, 2018 REAL Select Date NOMINAL_ Select Date REAL -t- 1MO 3MO 6MO 1YR 2YR 3YR SYR TYR 10YR 20YR 30YR Maturity Note: X-Axis (Matrit is not to scale View Text Version of Treasury Yield Curve Data for real maturities may not be available for all dates for which nominal maturity data is available
Step by Step Solution
There are 3 Steps involved in it

Get step-by-step solutions from verified subject matter experts