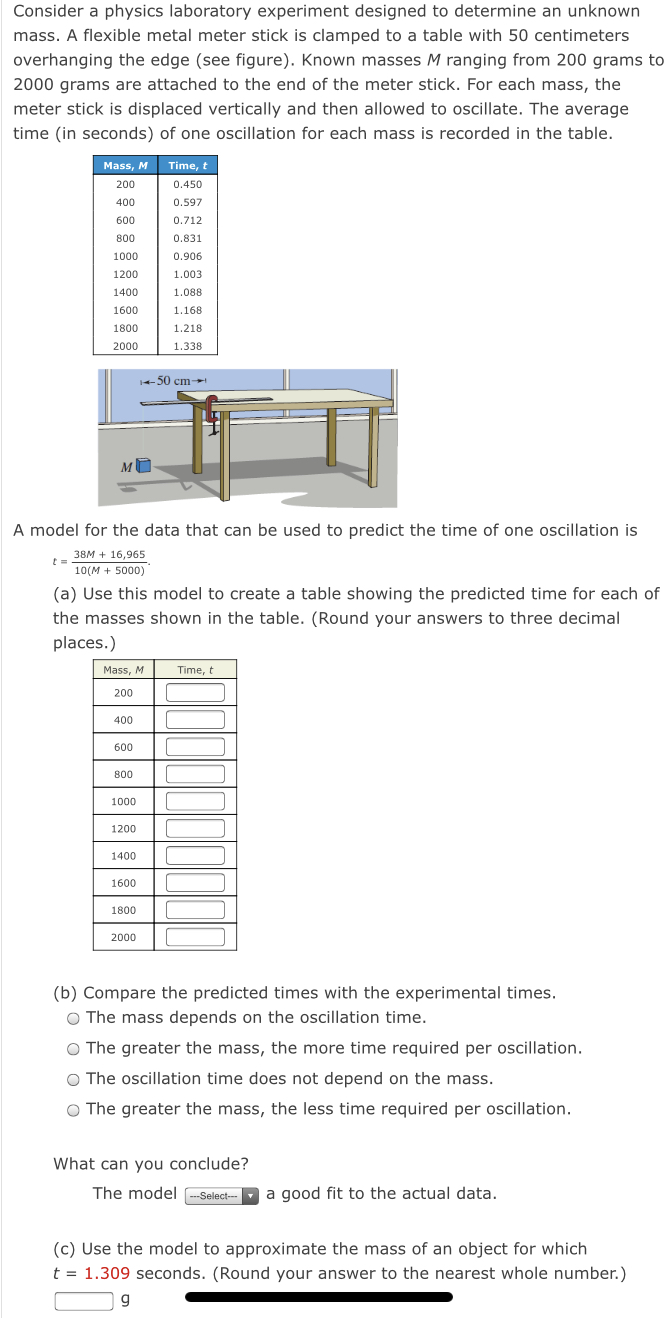
Question: https://www.webassign.net/cengageei/precalc/topic12/transformation_1_by_x.html Consider a physics laboratory experiment designed to determine an unknown mass. A exible metal meter stick is clamped to a table with 50 centimeters

https://www.webassign.net/cengageei/precalc/topic12/transformation_1_by_x.html

https://www.webassign.net/cengageei/precalc/topic1https://www.webassign.net/cengageei/precalc/topic1https://www.webassign.net/cengageei/precalc/topic1
Consider a physics laboratory experiment designed to determine an unknown mass. A exible metal meter stick is clamped to a table with 50 centimeters overhanging the edge [see figure}. Known masses M ranging from 200 grams to 2000 grams are attached to the end of the meter stick. For each mass, the meter stick is displaced vertically and then allowed to oscillate. The average time (in seconds) of one oscillation for each mass is recorded in the table. Massf M Time, t A model for the data that can be used to predict the time of one oscillation is f_ 33\" + 15.955 mm + sooo)' (a) Use this model to create a table showing the predicted time for each of the masses shown in the table. (Round your answers to three decimal places.) (b) Compare the predicted times with the experimental times. 0 The mass depends on the oscillation time. D The greater the mass, the more time required per oscillation. o The oscillation time does not depend on the mass. 0 The greater the mass, the less time required per oscillation. What can you conclude? The model a good t to the actual data. (c) Use the model to approximate the mass of an object for which t = 1.309 seconds. (Round your answer to the nearest whole number.) {2 g _ science class performs an experiment comparing the quantity of food consumed by a species of moth with the quantity of food supplied. The model or the experimental data is 1.563x - 0.001 *>0 6.380x + 1 where x is the quantity (in milligrams) of food supplied and y is the quantity (in milligrams) of food consumed. (a) Use a graphing utility to graph this model. 1.0 10 0.8 0.6 0.4 0.2 N - X O 0.2 0.4 0.6 0.8 1.0 O 2 0.25 0.25 0.20 0.20 0.15 0.15 0.10 0.10 0.05 0.05 O 0.2 0.4 0.6 0.8 1.0 (b) At what level of consumption will the moth become satiated? (Round your answer to three decimal places.) |0.247 mgReview the Explore It, then use it to complete the exercise below. Click here to access the Explore It in a new window. The graph of v =$ has a horizontal aSymptote with equation y: o and a vertical asymptote with equation x = a. (a) [bi id (d! [e] The graph of,= 1 7 has a horizontal asymptote with equation y: 1+5 and a vertical asymptote with equation x = E The graph on: 94%) has a horizontal aswymptote with equation y = and a vertical asymptote with equation x = U The graph of y = i = i has a horizontal asymptote with equation v =|:| X X and a vertical asymptote with equation x = . l The graph Ofy = 4( j) + a has a horizontal asymptote with equation 30! y: and a vertical asymptote with equation x: . The location of the horizontal asymptote of the graph is transformed by which of the following. 0 vertical shift only 0 vertical shift or vertical stretchfshrink O horizontal shift only 0 horizontal shift or reflection in the y-axis The location of the vertical asymptote of the graph is transformed by which of the following. 0 vertical shift only G horizontal shift only {3 vertical shift or reflection in the x-axis 0 horizontal shift or horizontal stretchishrink

Step by Step Solution

There are 3 Steps involved in it

1 Expert Approved Answer
Step: 1 Unlock blur-text-image
Question Has Been Solved by an Expert!

Get step-by-step solutions from verified subject matter experts

Step: 2 Unlock
Step: 3 Unlock

Students Have Also Explored These Related Mathematics Questions!