

Question: Human Resources Inc. ( HR Inc. ) is a small company that conducts monthly seminars on productivity issues for corporate executives. HR Inc. focuses on
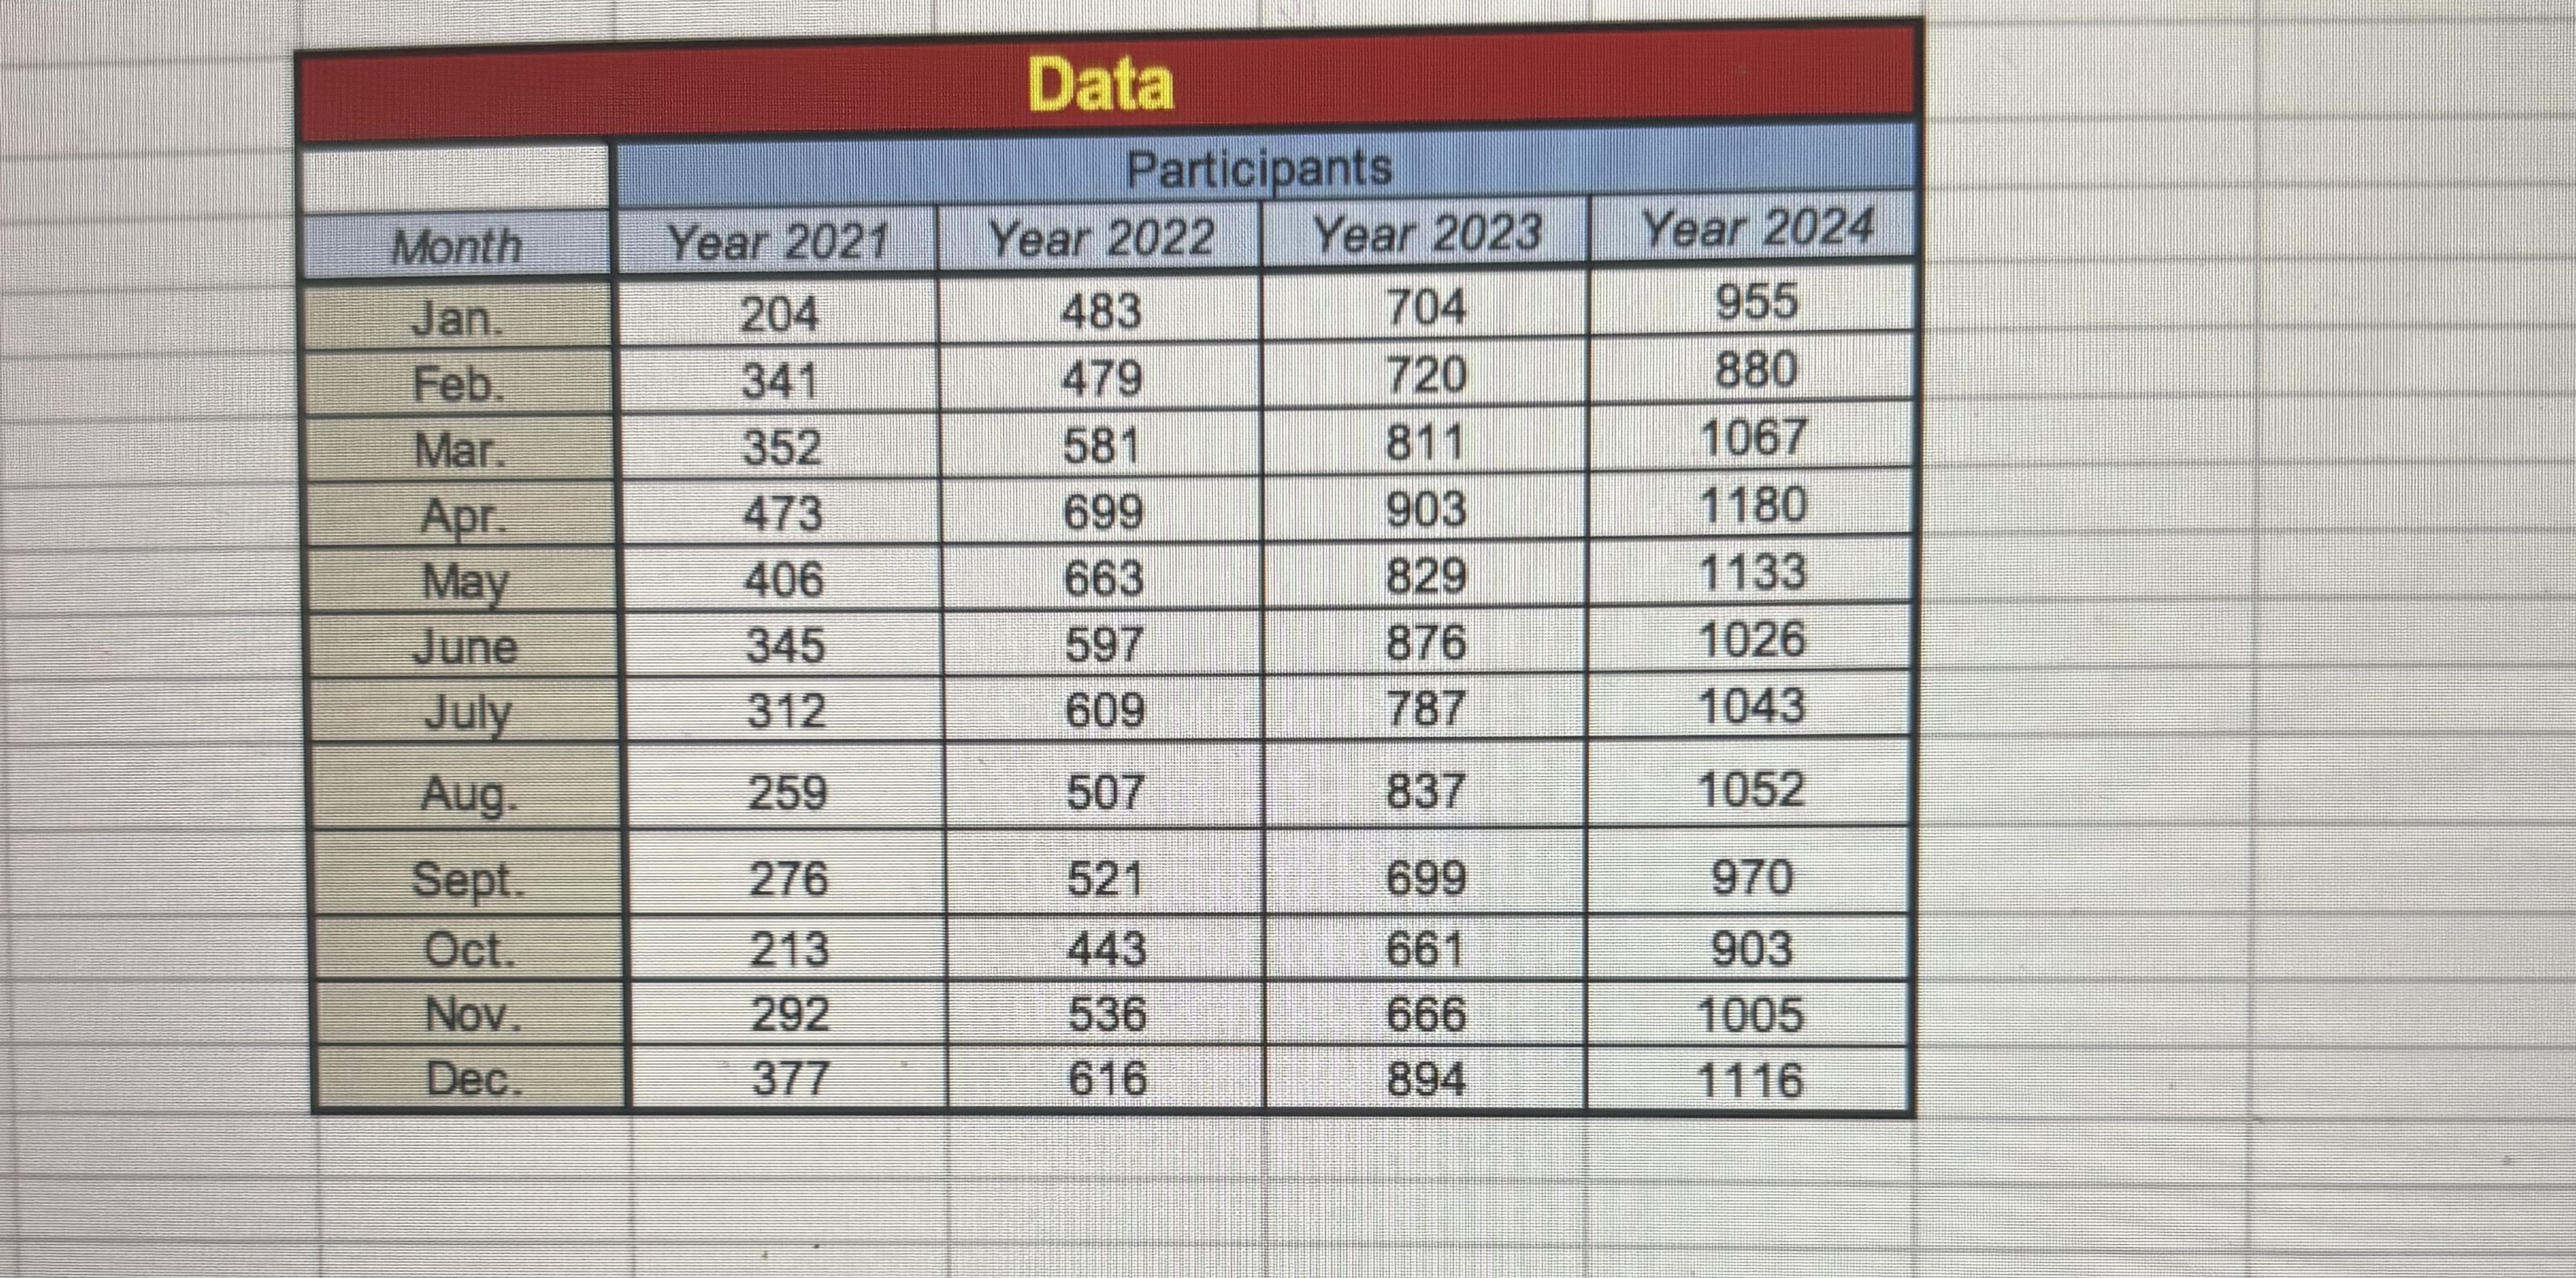
Human Resources Inc. HR Inc. is a small company that conducts monthly seminars on productivity issues for corporate executives. HR Inc. focuses on improving the quality of work and the attitude of workers in service organizations. The company provides seminar participants the tools essential for dealing with hardtomeasure issues. Originally, its seminars were geared toward hospital administration specifically, topics included motivating nursing staff and providing quality patient care. Over the years, the demand for the seminar has grown, as has the company's client base. Clients now include insurance executives who want to improve the quality and productivity of their claim recorders, travel agency directors who wish to enhance services, and managers of secretarial pools who want to improve the attitudes in their offices.HR Inc. has offered one seminar each month since Each seminar lasts three days and is typically held at a resort or spa. The location has varied over the years.The following table shows the data on the number of participants attending seminars since the first seminar. The seminar manager would like to use historical data to forecast the number of seminar participants in the future.Table. The number of Participants Project Assignments: use the Excel Spreadsheet file posted to complete the following.A spreadsheet file named Template has been posted in the same Canvas folder. The Template file provides a structured format to answer the questions asked in the project. Students are encouraged to use the Template to complete the project. Note: You are strongly suggested to convert the data given in the table into a time series data columns B to E of the template file when you start to answer the questions asked. This should be used to make your job easier.Q ForecastUse the following three forecast methods to forecast the # of participants for January a Use a month Moving Average Methodb Use a Linear Projection Forecast Method.c Use an Exponential Smoothing Forecast Method, Assume a and an initial forecast for May is Q Evaluate Forecast Accuracy and Compare different forecast methods.To compare the accuracy of the three forecast methods, do the following.a Apply the forecast methods to the historical periods. Please do the following,i Use a Month Moving Average Method to forecast the # of participants from April to December ii Use a Linear Projection Forecast Method to forecast the # of participants from January to December iii Use an Exponential Smoothing Forecast Method to forecast the # of participants from June to December Assume a and an initial forecast for May is b Visually compare the forecasts from the three methods and guess which method is the best. To do so you need to complete the following.i Plot One Chart that contains all following Data Series over time January to December :a the historical data series,b the forecasts made from Qa i to a iiiii Use the Chart you plotted to discussa Use the plotted historical data series chart to discuss the data pattern for the # of participants over time.b From the plots of i the historical data and ii all three forecast data series, which forecast method is the best based on a visual inspection?c Assessing which of the three forecast methods is best using a Forecastone Error Measurements discussed in the course. That is you need toi Select One of the three forecast Error Measurements MAD MSE, or MAPE then calculate the forecasting errors for the forecasts obtained in question Qaii Then, draw a conclusion on which forecast method provided the best forecast result based on the results of Error Measurement.iii Is your conclusion the same as what you have concluded in bii Note: When you compare the forecasting errors, it is important to compare them fairly. That is we use the same Forecasting Range when we calculate forecast Error measurements.Q Adaptive Smoothing of an Exponential Forecasting method.Use the same Forecast Error Measurement you used in Qc to find the Best smoothing parameter a of the Exponential Smoothing Forecast Method, assuming an initial forecast for May is Note: The Best smoothing parameter a is the value that will lead to the Smallest forecast error measurement.Q Tracking SignalUse the Linear Trend forecasts method Qc calculate the Tracking Signal for forecasts from January to December plot the Tracking Signal Chart assuming control limits C and C then make a conclusion on whether or not the forecasts are Biased when applied the Linear Trend method to the collected historical data.Q Develop Your Forecasting MethodBy observation from the chart you created and discussion from Q b you should have concluded that the given year historical data followed a combination of Trend and Seasonal data patterns. As a result, we can conclude that all three forecast methods, the Moving average, Linear Trend Project, and Exponential Smoothing Methods used in Q and Q are Not Good Forecasting methods. Please elaborate.Design a Forecasting Method that might be better suited to the given historical data pattern that is your forecasting method should address both the Trend and Seasonal data pattern Thena Use your Forecasting Method to forecast the # of participants for January to December b Compare the forecast accuracy of your Forecast Method and the three methods we used Q&Q That isi Use your Forecasting Method to forecast the # of participants from January to December ii Then, use the Same Forecast Error Measurement you used in Question to calculate the Forecast Error of your method from part iuse the same range of forecasts as you used in Question so that you can have a fair comparison then compare it with the forecasting errors you obtained in Q c Can you conclude your forecast method is the best? With excel functions.
Step by Step Solution
There are 3 Steps involved in it
1 Expert Approved Answer
Step: 1 Unlock

Question Has Been Solved by an Expert!
Get step-by-step solutions from verified subject matter experts
Step: 2 Unlock
Step: 3 Unlock