

Question: HW 0 2 - S 1 : During Lecture 2 ( LO 2 ) , we found the equation for the streamlines for a flow
HWS: During Lecture LO we found the equation for the streamlines for a flow field yxas well as
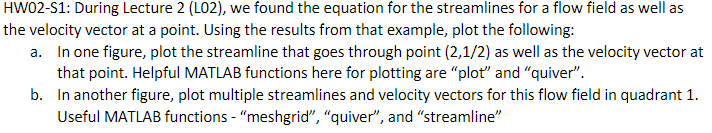
the velocity vector at a point u ms vmsUsing the results from that example, plot the following:
a In one figure, plot the streamline that goes through point as well as the velocity vector at
that point. Helpful MATLAB functions here for plotting are "plot" and "quiver".
b In another figure, plot multiple streamlines and velocity vectors for this flow field in quadrant
Useful MATLAB functions "meshgrid", "quiver", and "streamline"
Step by Step Solution
There are 3 Steps involved in it
1 Expert Approved Answer
Step: 1 Unlock

Question Has Been Solved by an Expert!
Get step-by-step solutions from verified subject matter experts
Step: 2 Unlock
Step: 3 Unlock