

Question: Hw 0 3 - Obj - A 2 : Problem 4 Problem Value: 1 point ( s ) . Problem Score; 5 0 % .
HwObjA: Problem
Problem Value: points Problem Score; Attempts Remaining: attempts.
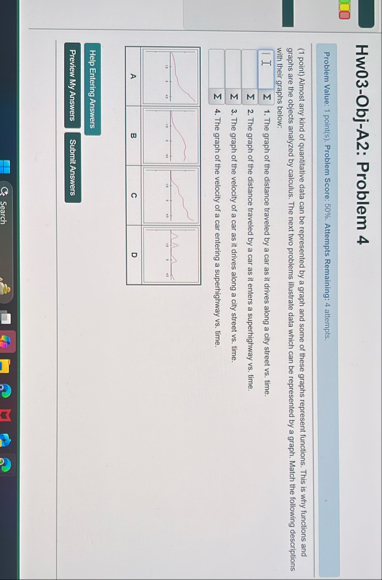
point Almost any kind of quantitative data can be represented by a graph and some of these graphs represent functions. This is why functions and graphs are the objects analyzed by calculus. The next two problems illustrate data which can be represented by a graph. Match the following descriptions with their graphs below:
The graph of the distance traveled by a car as if drives along a city street vs time.
The graph of the distance traveled by a car as it enters a superhighway vs time.
The graph of the velocity of a car as it drives along a city street vs time.
The graph of the velocity of a car entering a superhighway vs time.
Step by Step Solution
There are 3 Steps involved in it
1 Expert Approved Answer
Step: 1 Unlock

Question Has Been Solved by an Expert!
Get step-by-step solutions from verified subject matter experts
Step: 2 Unlock
Step: 3 Unlock