

Question: HW # 2 - Chapter 3 ( Similar to Book Chapter Problem # 8 , Pg 4 6 ) Submit in Canvas! You can do
HW # Chapter Similar to Book Chapter Problem # Pg
Submit in Canvas! You can do by hand and take pic and upload file.
Look at end of this handout for HW tips and suggestions
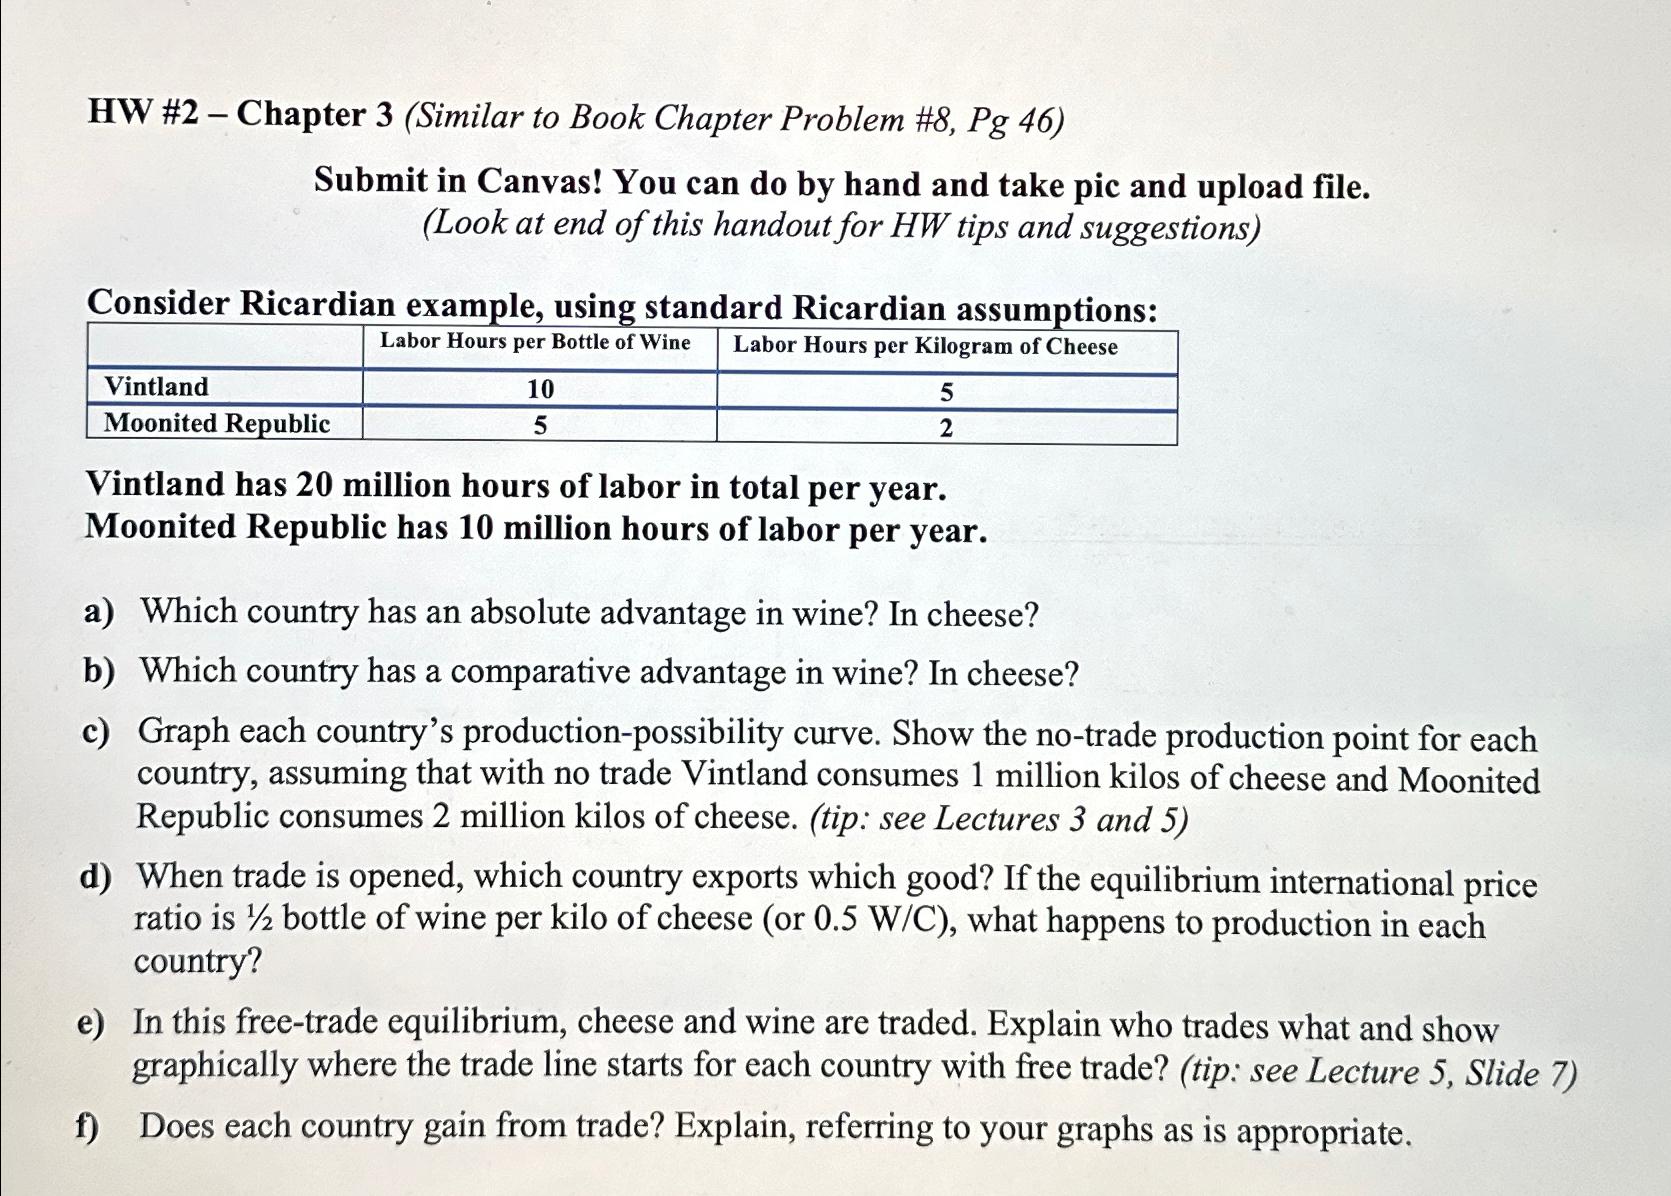
Consider Ricardian example, using standard Ricardian assumptions:
tableLabor Hours per Bottle of Wine,Labor Hours per Kilogram of CheeseVintlandMoonited Republic,
Vintland has million hours of labor in total per year.
Moonited Republic has million hours of labor per year.
a Which country has an absolute advantage in wine? In cheese?
b Which country has a comparative advantage in wine? In cheese?
c Graph each country's productionpossibility curve. Show the notrade production point for each country, assuming that with no trade Vintland consumes million kilos of cheese and Moonited Republic consumes million kilos of cheese. tip: see Lectures and
d When trade is opened, which country exports which good? If the equilibrium international price ratio is bottle of wine per kilo of cheese or what happens to production in each country?
e In this freetrade equilibrium, cheese and wine are traded. Explain who trades what and show graphically where the trade line starts for each country with free trade? tip: see Lecture Slide
f Does each country gain from trade? Explain, referring to your graphs as is appropriate.
Step by Step Solution
There are 3 Steps involved in it
1 Expert Approved Answer
Step: 1 Unlock

Question Has Been Solved by an Expert!
Get step-by-step solutions from verified subject matter experts
Step: 2 Unlock
Step: 3 Unlock