

Question: a. In the graph below, identify the areas of consumer surplus and producer surplus. Instructions: Use the tool provided PS to identify the area
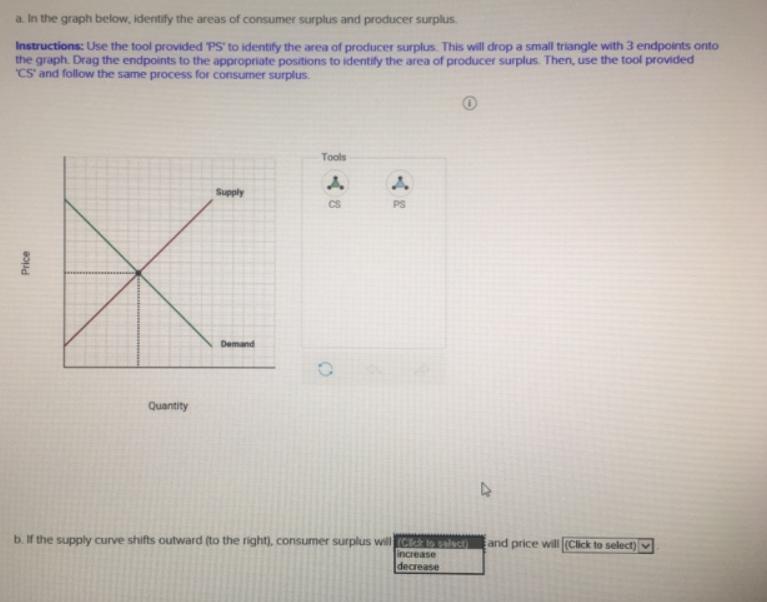
a. In the graph below, identify the areas of consumer surplus and producer surplus. Instructions: Use the tool provided PS to identify the area of producer surplus. This will drop a small triangle with 3 endpoints onto the graph. Drag the endpoints to the appropriate positions to identify the area of producer surplus Then, use the tool provided CS' and follow the same process for consumer surplus. Price Quantity Supply Demand Tools CS O PS b. If the supply curve shifts outward (to the right), consumer surplus will (Click to select) increase decrease 4 and price will (Click to select)
Step by Step Solution
3.41 Rating (160 Votes )
There are 3 Steps involved in it
a Price Rest PS Expl... View full answer

Get step-by-step solutions from verified subject matter experts