

Question: HW.12 - RWJ.12 (Module 5A) Saved 3 Suppose the returns on long-term corporate bonds are normally distributed. Figure 12.10. Refer to Table A.5 10 points
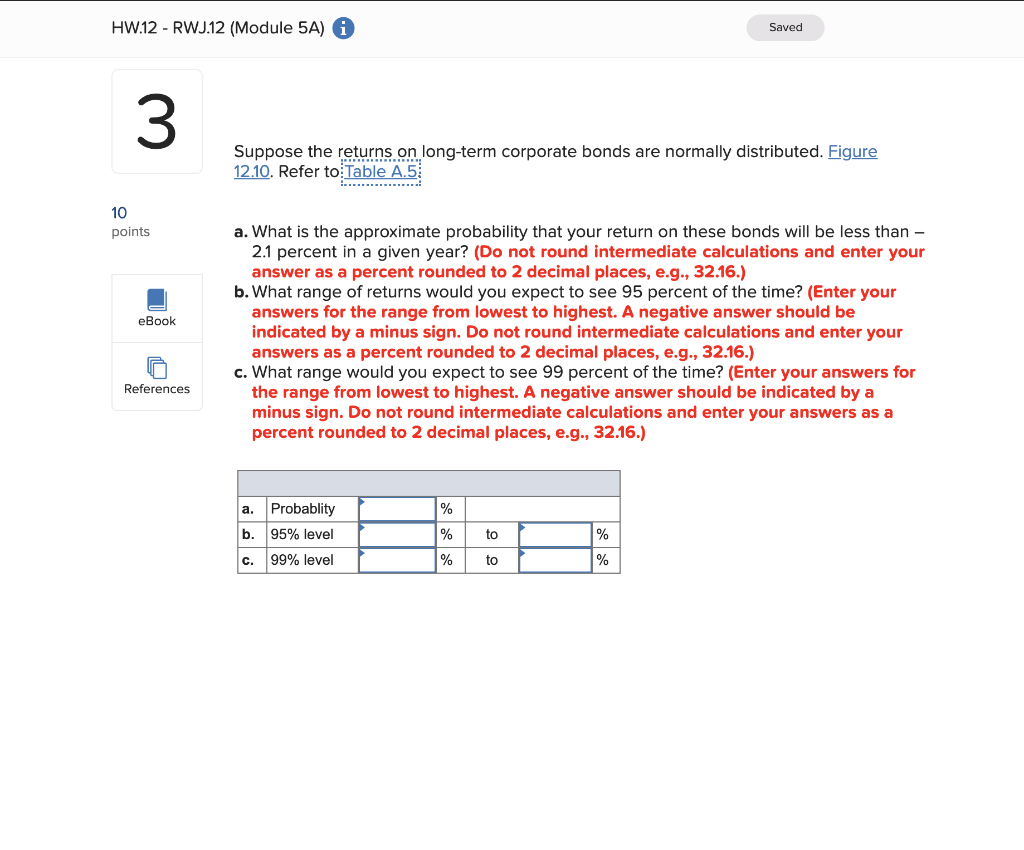
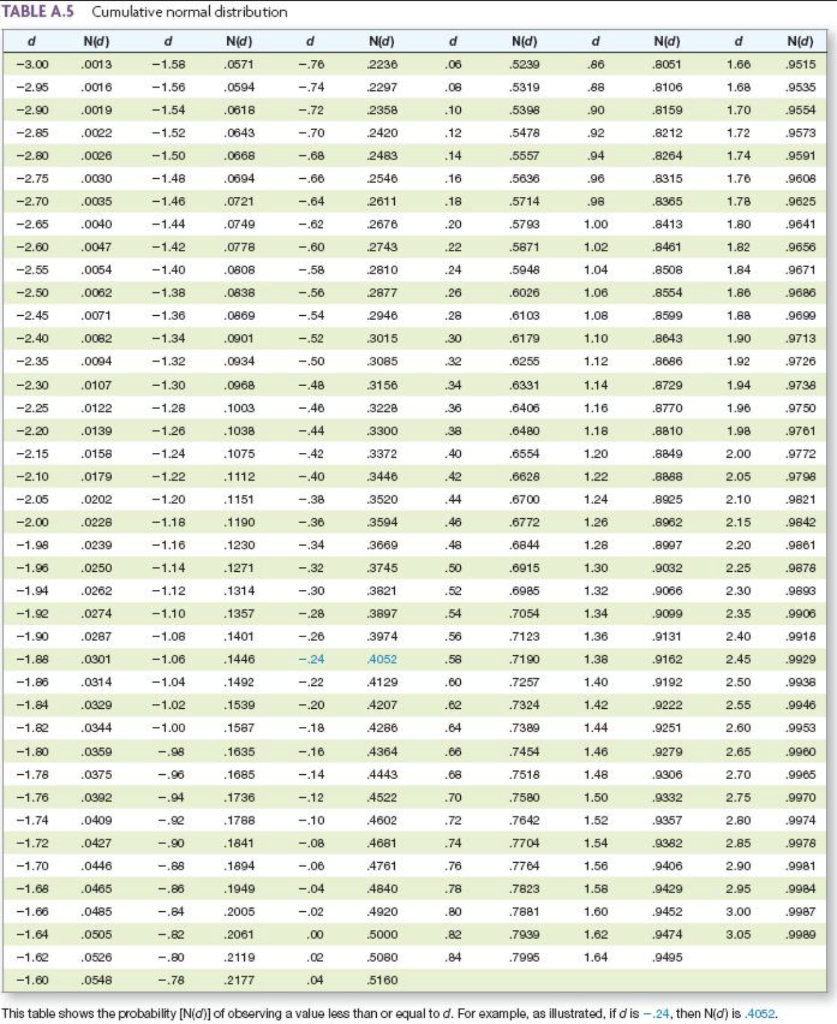
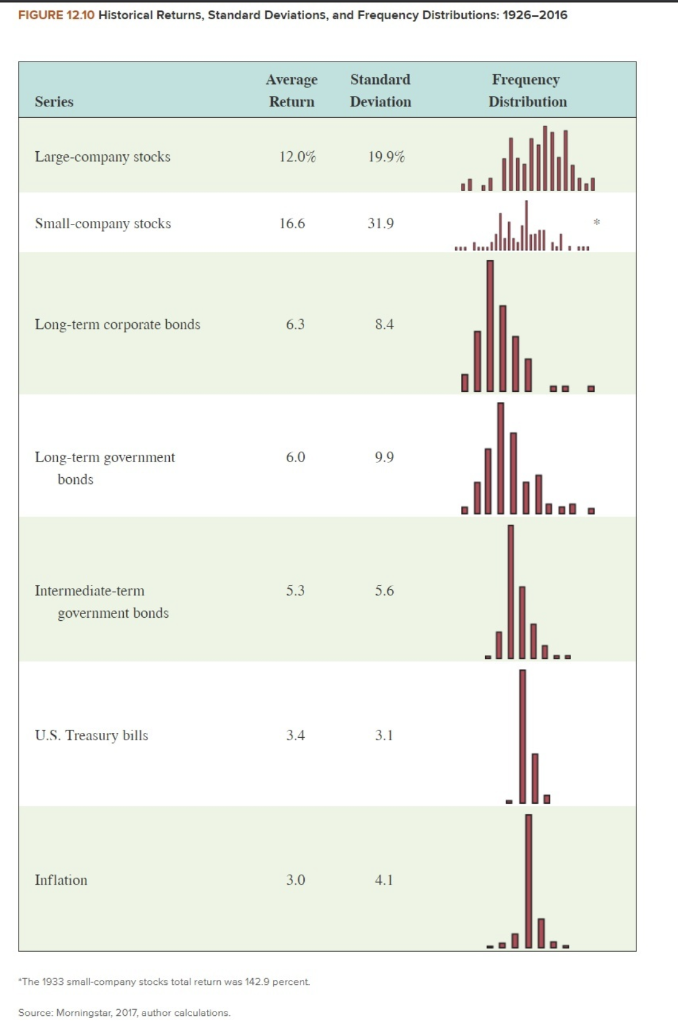
HW.12 - RWJ.12 (Module 5A) Saved 3 Suppose the returns on long-term corporate bonds are normally distributed. Figure 12.10. Refer to Table A.5 10 points eBook a. What is the approximate probability that your return on these bonds will be less than - 2.1 percent in a given year? (Do not round intermediate calculations and enter your answer as a percent rounded to 2 decimal places, e.g., 32.16.) b. What range of returns would you expect to see 95 percent of the time? (Enter your answers for the range from lowest to highest. A negative answer should be indicated by a minus sign. Do not round intermediate calculations and enter your answers as a percent rounded to 2 decimal places, e.g., 32.16.) c. What range would you expect to see 99 percent of the time? (Enter your answers for the range from lowest to highest. A negative answer should be indicated by a minus sign. Do not round intermediate calculations and enter your answers as a percent rounded to 2 decimal places, e.g., 32.16.) References % a. Probablity b. 95% level c. 99% level % to % % to % TABLE A.5 Cumulative normal distribution d Nd) d d d Nd) .0571 .0594 Nd) .8051 d -.76 -.74 d 1.66 -3.00 Nad) .9515 .0013 .06 .86 -2.95 .0016 N(d) 2236 .2297 .2358 2420 .06 .88 .8106 1.68 .9535 Nd) .5239 .5319 .5398 .5478 .5557 -2.90 .0019 .0618 .10 .90 -1.58 -1.56 -1.54 -1.52 -1.50 -1.48 .8159 .9554 -.72 -.70 -2.85 .0002 .0643 .12 .92 .8212 .9573 -2.80 .0026 -.68 .14 .94 .8264 .9591 .0030 1.70 1.72 1.74 1.76 1.78 1.80 -.66 .16 .5636 .96 .8315 .9608 .0668 .0694 .0721 .0749 .0035 -1.46 -.64 .18 .5714 .98 -2.75 -2.70 -2.65 -2.60 .9625 2483 2546 2611 2676 2743 2810 -.62 .20 1.00 .9641 .0040 .0047 -1.44 -1.42 .0778 -.60 .22 .5798 .5871 .5948 1.02 .8365 .8413 .8461 .8508 .8554 1.82 .9656 .9671 -2.55 .0054 -1.40 .0806 -.58 .24 1.04 1.84 -2.50 .0062 -1.38 .0838 -.56 2877 .26 1.06 1.86 .9686 -2.45 -1.36 0869 -.54 2946 .28 1.08 .8599 1.88 .9699 .6026 .6108 .6179 .6256 .0071 .0062 .0094 -2.40 -1.34 .0901 -.52 3015 .30 1.10 .8643 1.90 .9713 .0934 -.50 .32 1.92 .9726 -2.35 -2.30 -1.32 -1.30 1.12 1.14 .0107 .0968 -.48 .34 .6331 .8686 .8729 .8770 1.94 .3085 3156 3228 .3300 .9738 -2.25 -1.28 .1003 -.46 .36 .6406 1.16 1.96 .9750 .0122 .0139 -2.20 -1.26 .1038 -.44 .38 .6480 1.16 .8810 1.98 .9761 -2.15 .0158 -1.24 .3372 .40 1.20 .8849 2.00 .9772 -.42 -40 .0179 .1075 .1112 .1151 3446 1.22 .8888 .6554 .6628 .6700 -2.10 -2.05 2.05 .9798 -1.22 - 1.20 -1.18 .42 .44 .0202 -.38 .3520 1.24 2.10 .9821 -2.00 -.36 3594 46 .6772 2.15 .8925 .8962 .8997 9842 .0228 .0239 .0250 .1190 .1230 .1271 -34 .3669 .48 .6844 -1.98 -1.96 2.20 .9861 - 1.16 -1.14 -1.12 1.26 1.26 1.30 1.32 -.32 .3745 .6915 .9032 2.25 .9876 .50 .52 -1.94 .0262 .1314 -30 3821 .6985 .9066 2.30 .9893 -1.se -1.10 .1357 - 28 3897 .54 .7054 1.34 .9906 -1.90 .0274 .0287 .0001 -1.08 1401 - 26 1.36 3974 4052 .9918 .7123 .7190 .9099 .9131 .9162 .9192 2.35 2.40 2.45 -1.88 .56 .58 .60 .1446 -1.06 -1.04 .9929 1.38 1.40 .0314 - 24 -22 - 20 .7257 2.50 -1.86 -1.84 .9938 .1492 .1539 .4129 4207 .0329 .62 .7324 1.42 .9222 2.55 .9946 -1.02 -1.00 -1.82 .0344 .1587 -18 4286 .64 .7389 1.44 .9251 2.60 .9953 -1.80 -.98 .1635 .60 .7454 1.46 .9279 2.65 .9980 -.96 .1685 08 4364 4443 .4522 1.48 .9306 2.70 -1.78 -1.76 -1.74 .9905 -10 -.14 -12 -10 -.94 .70 1.50 .9332 2.75 .9970 .1736 .1788 .7518 .7580 .7642 .7704 .72 1.52 .9357 2.80 .9974 -1.72 -.90 .1841 -.08 .74 1.54 .9982 2.85 .9978 -1.70 .0359 .0375 .0392 .0409 .0427 .0446 .0465 .0485 .0505 .0526 .0548 -.88 .1894 -.06 .76 .7764 .9406 2.90 .9981 1.56 1.58 -1.68 -.88 .1949 -.04 .78 .9429 2.95 .9984 .4602 .4681 4761 4840 4920 .5000 .5080 .5160 -.84 .2005 .80 1.60 .9452 3.00 .9987 -1.66 -1.64 -.02 .00 .7823 7881 .7939 .7996 -.82 .82 .9474 3.05 .9989 .2061 .2119 1.62 1.64 -1.62 -.80 . .84 .9495 -1.60 -.78 .2177 .04 This table shows the probability [N(d) of observing a value lees than or equal to d. For example, as illustrated, if d is -24, then Nid) is 4052. FIGURE 12.10 Historical Returns, Standard Deviations, and Frequency Distributions: 1926-2016 Average Return Standard Deviation Frequency Distribution Series Large-company stocks 12.0% 19.9% . Small-company stocks 16.6 31.9 Long-term corporate bonds 6.3 8.4 6,0 9.9 Long-term government bonds 5.3 5.6 Intermediate-term government bonds U.S. Treasury bills 3.4 3.1 Inflation 3.0 4.1 .... "The 1933 small-company stocks total return was 142.9 percent Source: Morningstar, 2017, author calculations
Step by Step Solution
There are 3 Steps involved in it

Get step-by-step solutions from verified subject matter experts