

Question: HW3-2 (20%) : The Volatility IndeX (VIX) is an indicator published by the Chicago Board Options Exchange that corresponds to the market's expectation of future
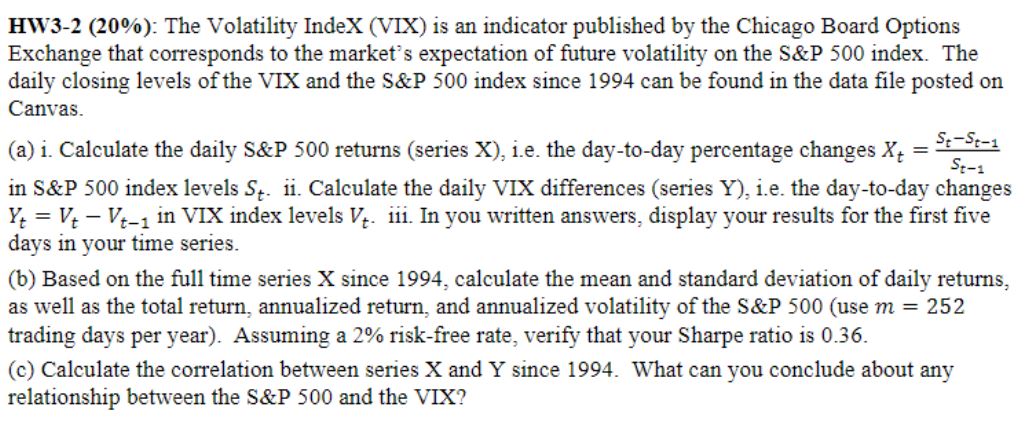
HW3-2 (20%) : The Volatility IndeX (VIX) is an indicator published by the Chicago Board Options Exchange that corresponds to the market's expectation of future volatility on the S\&P 500 index. The daily closing levels of the VIX and the S\&P 500 index since 1994 can be found in the data file posted on Canvas. (a) i. Calculate the daily S\&P 500 returns (series X), i.e. the day-to-day percentage changes Xt=St1StSt1 in S&P500 index levels St. ii. Calculate the daily VIX differences (series Y ), i.e. the day-to-day changes Yt=VtVt1 in VIX index levels Vt. iii. In you written answers, display your results for the first five days in your time series. (b) Based on the full time series X since 1994 , calculate the mean and standard deviation of daily returns, as well as the total return, annualized return, and annualized volatility of the S\&P 500 (use m=252 trading days per year). Assuming a 2\% risk-free rate, verify that your Sharpe ratio is 0.36 . (c) Calculate the correlation between series X and Y since 1994. What can you conclude about any relationship between the S\&P 500 and the VIX? HW3-2 (20%) : The Volatility IndeX (VIX) is an indicator published by the Chicago Board Options Exchange that corresponds to the market's expectation of future volatility on the S\&P 500 index. The daily closing levels of the VIX and the S\&P 500 index since 1994 can be found in the data file posted on Canvas. (a) i. Calculate the daily S\&P 500 returns (series X), i.e. the day-to-day percentage changes Xt=St1StSt1 in S&P500 index levels St. ii. Calculate the daily VIX differences (series Y ), i.e. the day-to-day changes Yt=VtVt1 in VIX index levels Vt. iii. In you written answers, display your results for the first five days in your time series. (b) Based on the full time series X since 1994 , calculate the mean and standard deviation of daily returns, as well as the total return, annualized return, and annualized volatility of the S\&P 500 (use m=252 trading days per year). Assuming a 2\% risk-free rate, verify that your Sharpe ratio is 0.36 . (c) Calculate the correlation between series X and Y since 1994. What can you conclude about any relationship between the S\&P 500 and the VIX
Step by Step Solution
There are 3 Steps involved in it

Get step-by-step solutions from verified subject matter experts