

Question: HW5-Ch6S Statistical Process Control Homework 1. Computer upgrade times (in minutes) are being evaluated. Samples of five observations each have been taken, and the 1.
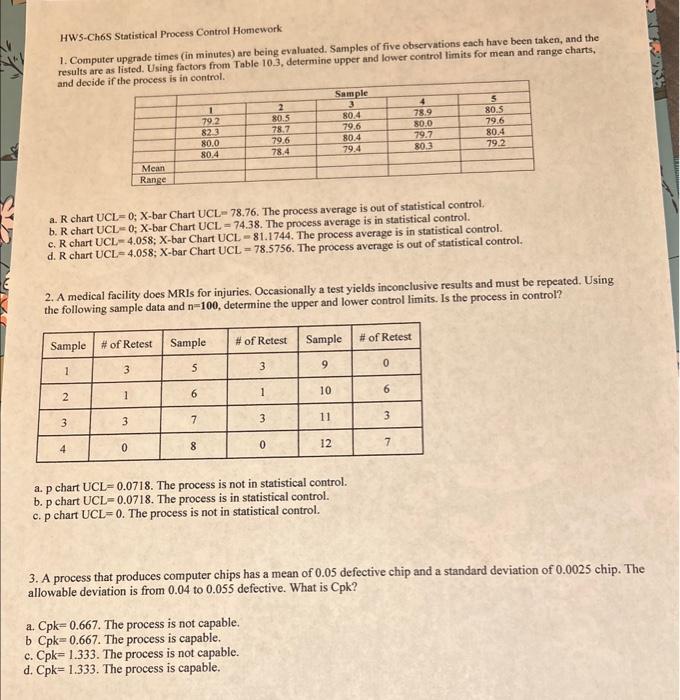
HW5-Ch6S Statistical Process Control Homework 1. Computer upgrade times (in minutes) are being evaluated. Samples of five observations each have been taken, and the 1. Computer upgrade times (in minutes) are being evaluated. Samples of tive observations each have been taken, Using factors from Table 10.3, determine upper and lower control limits for mean and range charts, and deeide if the nmess is in control. a. R chart UCL=0;X-bar Chart UCL=78.76. The process average is out of statistical control. b. R chart UCL=0;X-bar Chart UCL=74.38. The process average is in statistical control. c. R chart UCL=4.058;X-bar Chart UCL=81.1744. The process average is in statistical control. d. R chart UCL=4.058;X-bar Chart UCL=78.5756. The process average is out of statistical control. 2. A medical facility does MRIs for injuries. Occasionally a test yields inconclusive results and must be repeated. Using the following sample data and n=100, determine the upper and lower control limits. Is the process in control? a. p chart UCL=0.0718. The process is not in statistical control. b. p chart UCL=0.0718. The process is in statistical control. c. p chart UCL=0. The process is not in statistical control. 3. A process that produces computer chips has a mean of 0.05 defective chip and a standard deviation of 0.0025 chip. The allowable deviation is from 0.04 to 0.055 defective. What is Cpk ? a. Cpk=0.667. The process is not capable. b Cpk=0.667. The process is capable. c. Cpk=1.333. The process is not capable. d. Cpk=1.333. The process is capable. HW5-Ch6S Statistical Process Control Homework 1. Computer upgrade times (in minutes) are being evaluated. Samples of five observations each have been taken, and the 1. Computer upgrade times (in minutes) are being evaluated. Samples of tive observations each have been taken, Using factors from Table 10.3, determine upper and lower control limits for mean and range charts, and deeide if the nmess is in control. a. R chart UCL=0;X-bar Chart UCL=78.76. The process average is out of statistical control. b. R chart UCL=0;X-bar Chart UCL=74.38. The process average is in statistical control. c. R chart UCL=4.058;X-bar Chart UCL=81.1744. The process average is in statistical control. d. R chart UCL=4.058;X-bar Chart UCL=78.5756. The process average is out of statistical control. 2. A medical facility does MRIs for injuries. Occasionally a test yields inconclusive results and must be repeated. Using the following sample data and n=100, determine the upper and lower control limits. Is the process in control? a. p chart UCL=0.0718. The process is not in statistical control. b. p chart UCL=0.0718. The process is in statistical control. c. p chart UCL=0. The process is not in statistical control. 3. A process that produces computer chips has a mean of 0.05 defective chip and a standard deviation of 0.0025 chip. The allowable deviation is from 0.04 to 0.055 defective. What is Cpk ? a. Cpk=0.667. The process is not capable. b Cpk=0.667. The process is capable. c. Cpk=1.333. The process is not capable. d. Cpk=1.333. The process is capable
Step by Step Solution
There are 3 Steps involved in it

Get step-by-step solutions from verified subject matter experts