

Question: HW6. Plot the resulting energies E in eV vs. [i21f21] using a computer spreadsheet program. This known as a 'Balmer plot'. Using your plot find
![HW6. Plot the resulting energies E in eV vs. [i21f21] using](https://dsd5zvtm8ll6.cloudfront.net/si.experts.images/questions/2024/09/66f8f4c752a19_62366f8f4c708dc7.jpg)
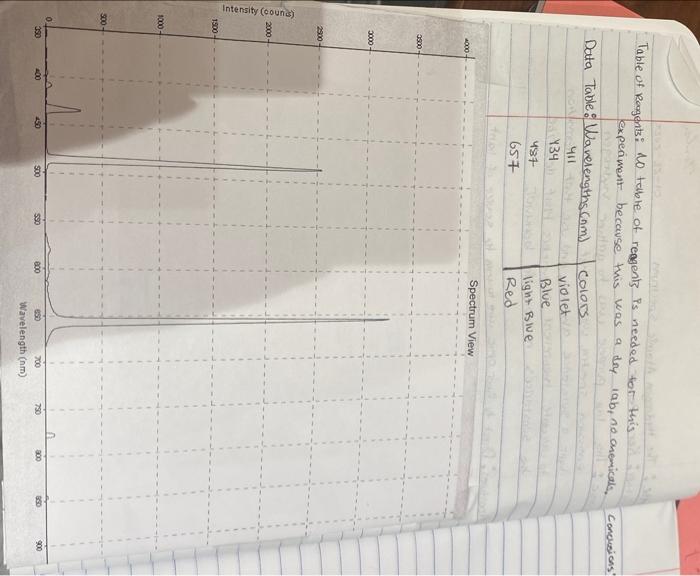
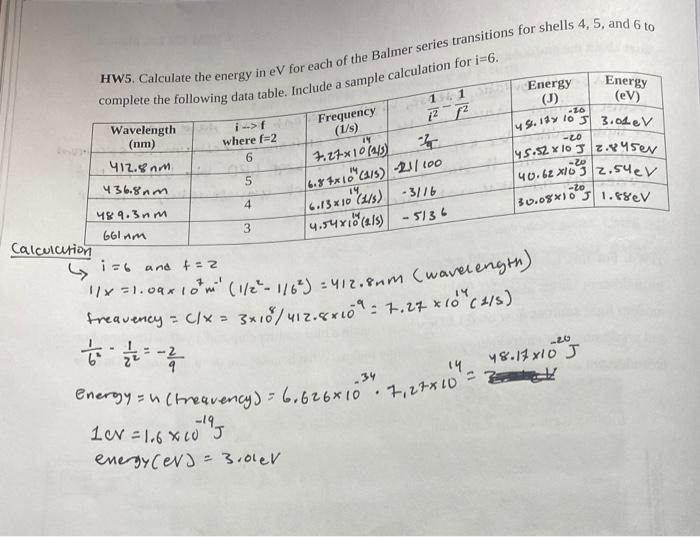
HW6. Plot the resulting energies E in eV vs. [i21f21] using a computer spreadsheet program. This known as a 'Balmer plot'. Using your plot find the "Best Fit" Trendline. The slope of this line is your Rydberg constant. Attach a copy of your graph to the end of this assignment. HW7. A. What was your experimental value for the Rydberg constant? B. How does this compare to the accepted literature value of 13.6eV ? Table of Rougents: Lo table of reggents is needed for this experiment because this was a doy iab, no onemiculs, Concusions: \begin{tabular}{c|c|l} Data Table: & Wavelengths ( and & Colors \\ & 411 & violet \\ 437 & Blue \\ & 657 & light Blue \\ & Red \end{tabular} i=6 and f=2 treavency =C1x=3108/412.8109=7.271014(1/s) HW6. Plot the resulting energies E in eV vs. [i21f21] using a computer spreadsheet program. This known as a 'Balmer plot'. Using your plot find the "Best Fit" Trendline. The slope of this line is your Rydberg constant. Attach a copy of your graph to the end of this assignment. HW7. A. What was your experimental value for the Rydberg constant? B. How does this compare to the accepted literature value of 13.6eV ? Table of Rougents: Lo table of reggents is needed for this experiment because this was a doy iab, no onemiculs, Concusions: \begin{tabular}{c|c|l} Data Table: & Wavelengths ( and & Colors \\ & 411 & violet \\ 437 & Blue \\ & 657 & light Blue \\ & Red \end{tabular} i=6 and f=2 treavency =C1x=3108/412.8109=7.271014(1/s)
Step by Step Solution
There are 3 Steps involved in it

Get step-by-step solutions from verified subject matter experts