

Question: Hye guys, based on this data, can someone help me to make a relationship Research Question. Thanks 2 X 9 CHAPTER 5 MGT648. X C
Hye guys, based on this data, can someone help me to make a relationship Research Question. Thanks
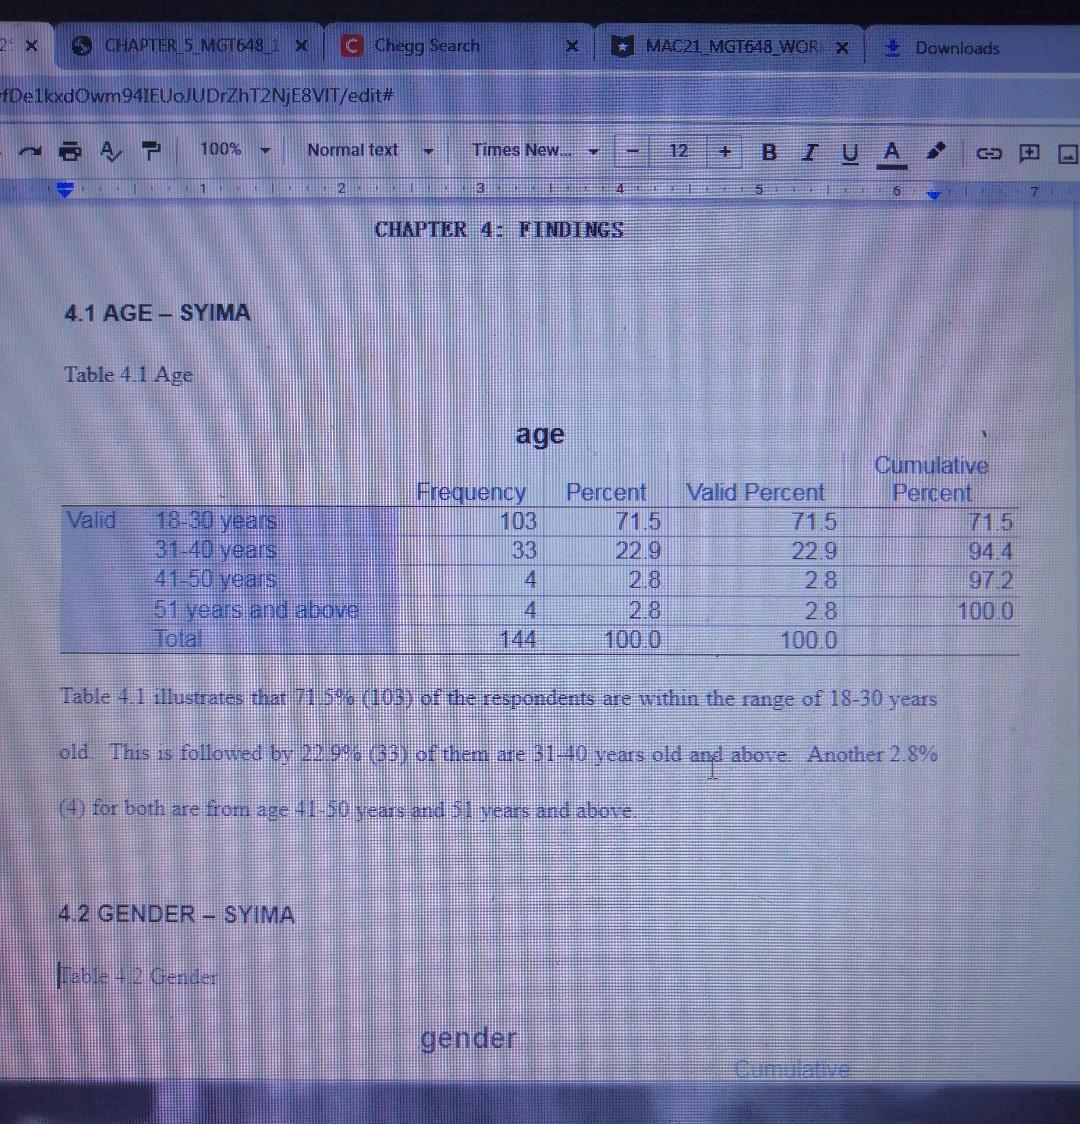
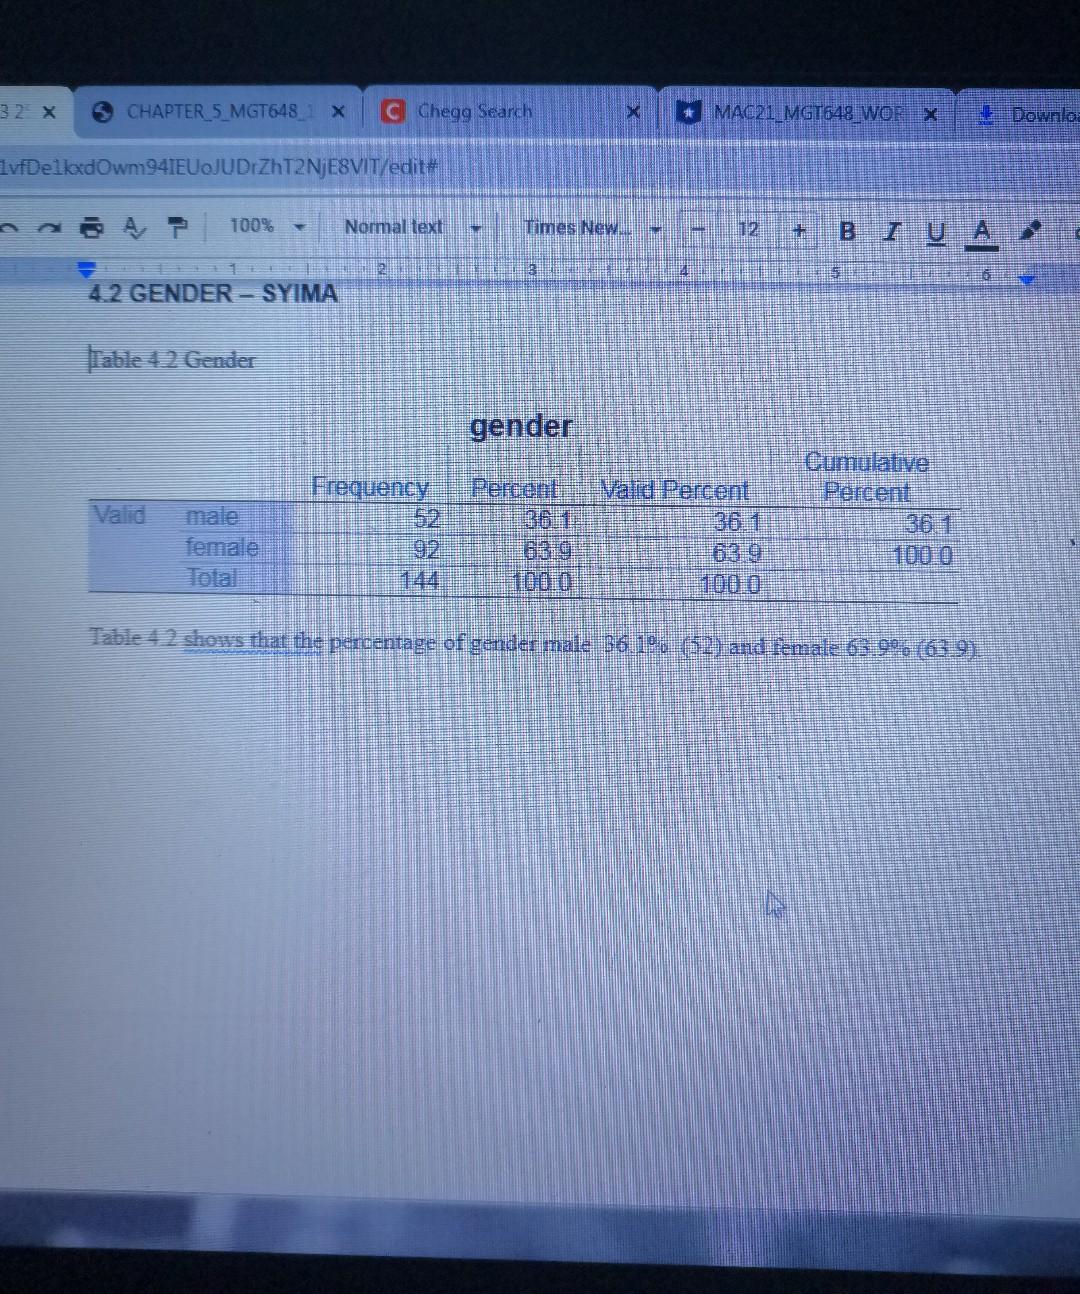
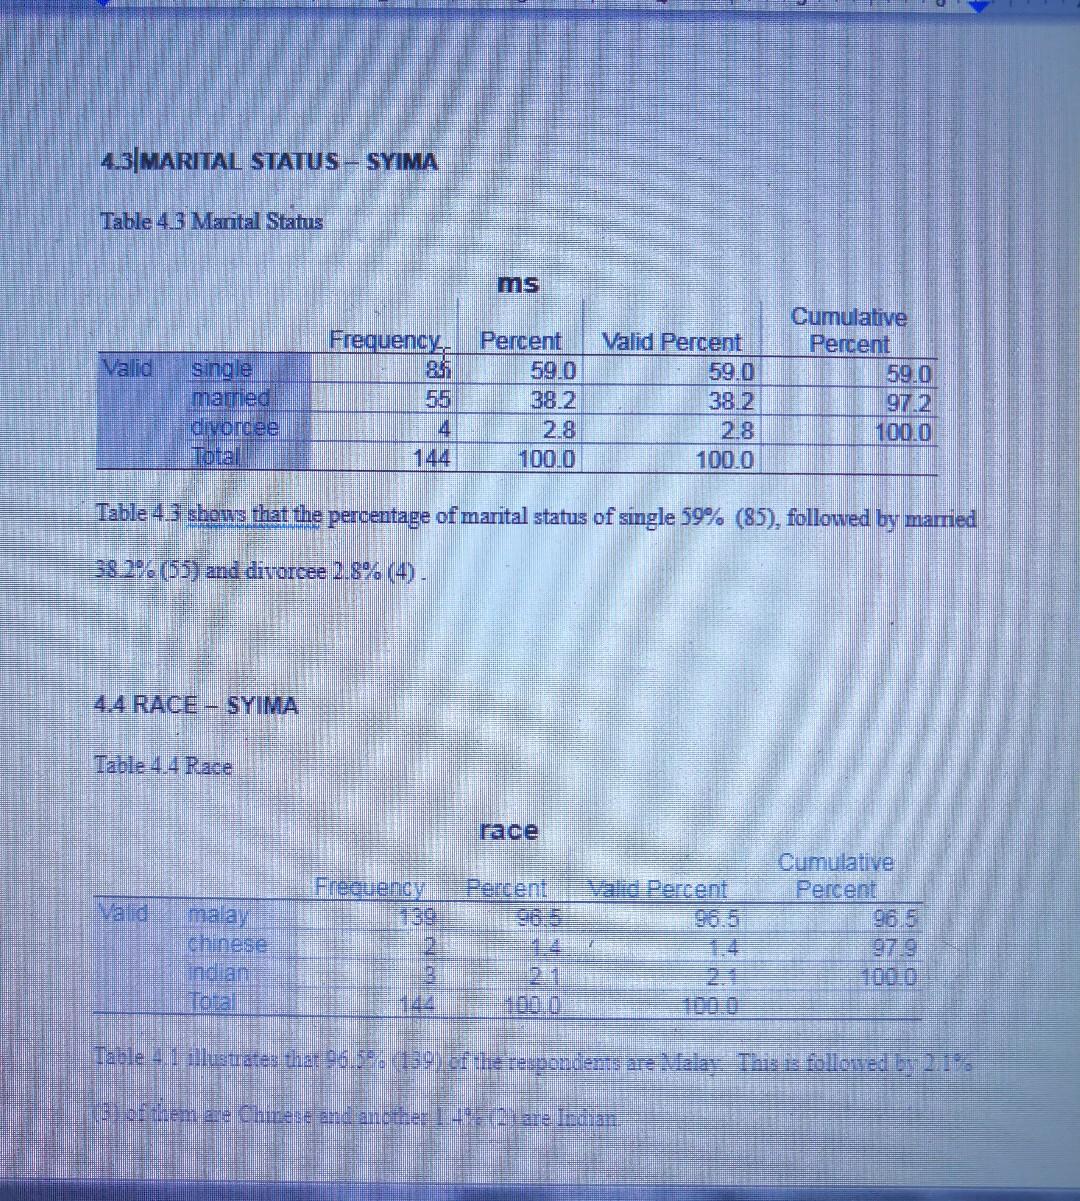
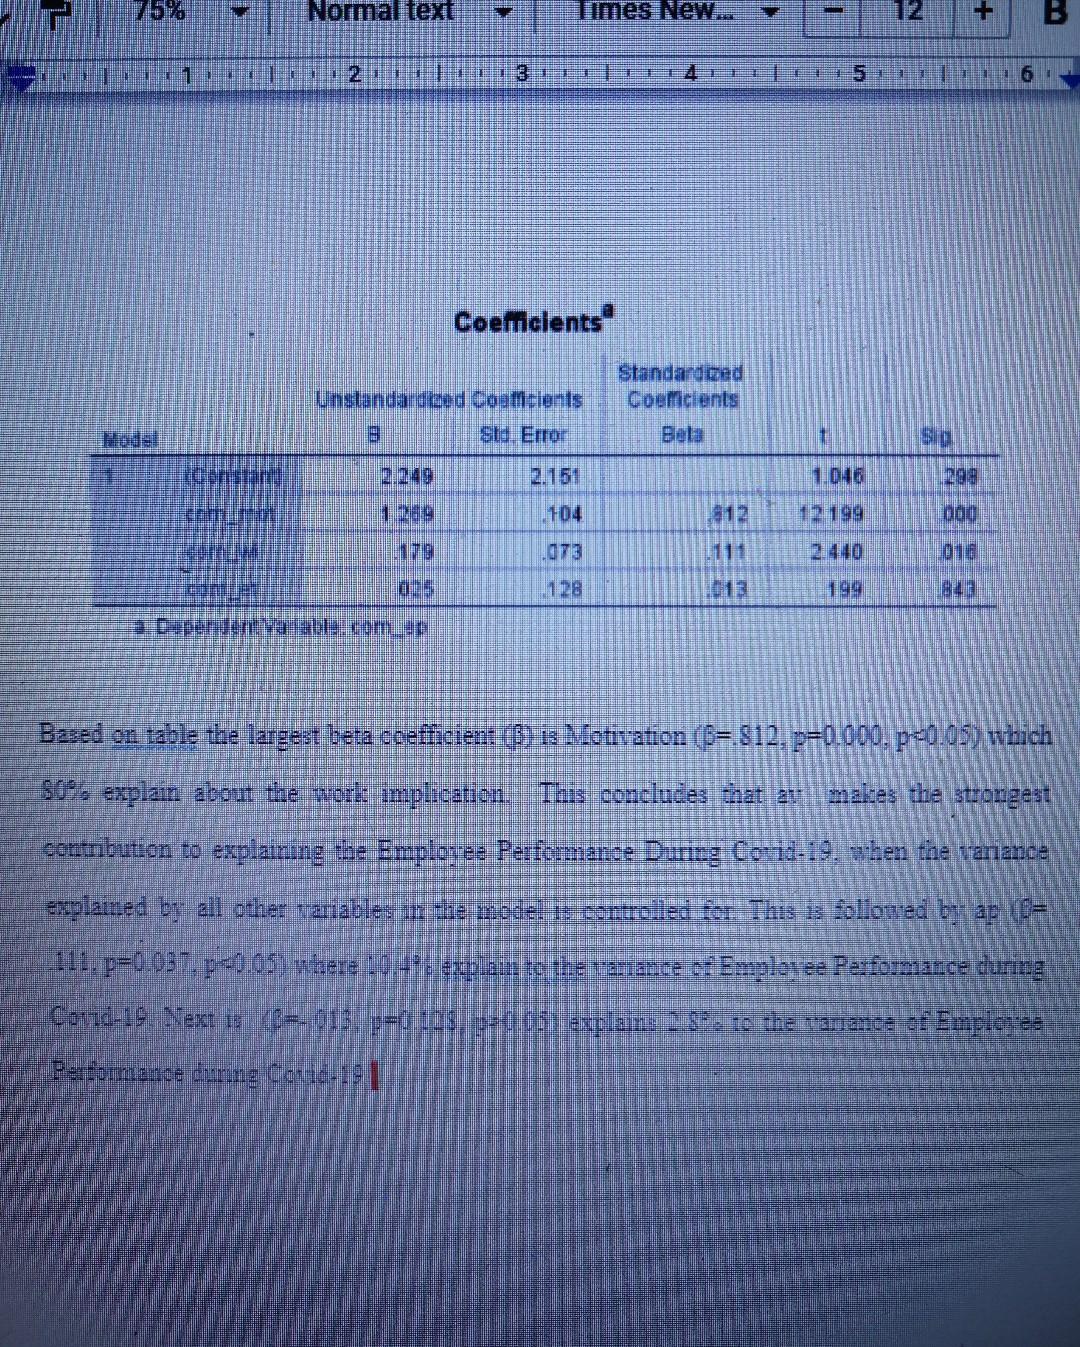
2 X 9 CHAPTER 5 MGT648. X C Chegg Search * MAC21 MGT648 WORX Downloads fDelkxdowm941EUJUDrZhT2NjE8VIT/edit# 100% Normal text Times News 12 B I U 1 2 3 5 ! CHAPTER 4: FINDINGS 4.1 AGE - SYIMA Table 4.1 Age age Cumulative Percent Valid 18-30 years 31-40 years 41=50 years 51 years and above Total Frequency 103 33 4 4 144 Percent 71.5 22.9 2.8 2.8 100.0 Valid Percent 715 22.9 2.8 28 100.0 94.4 97 2. 100.0 Table 4.1 illustrates that 71.59 (103) of the respondents are within the range of 18-30 years old. This is followed by 22.9** (33) of them me 31-40 years old and above. Another 2.8% (+) for both are from age 41-50 years and 5 ) Mears and above 4.2 GENDER SYIMA Fable + 2 Gender gender 32x CHAPTER 5_MGT648 x C Ghegg Search X * MAC21 MGT648 WOR x Downlo IvfDelkadowm94IEUOJUDrZhT2NjE8VIT/edit# 100% Normal text Times New 12 B 1 y A 2 3 4 15 16 4.2 GENDER SYIMA Table 42 Gender gender Frequency Percent Cumulative Percent Valid Percent Valid male female 1000 Table 2 shows that the percentage of gender male 36.10 (52) and female 63.90 (639) 4.3/MARITAL STATUS - SYIMA Table 4.3 Mantal Status Valid single mamed divorcee Total Frequency: Percent 59.0 55 38.2 4 2.8 100.0 Valid Percent 59.0 38 2 2.8 100.0 Cumulative Percent 59.0 972 100.0 Table 4.3 shows that the percentage of marital status of single 59% (85), followed by married 38.2% (55) and divorcee 2.8% (4) 4.4 RACE - SYIMA Table 4.4 Race race Frequency Cumulative Percent Percent Valid Percent on ma chinese indian 1.4 979 1500 1000 Table - 1 cleuates that 96.5%. 139, of the respondents are Nialay. This is followed by 1,16 33 of them are Chinese and another 1.49are Indian 15% Normal text Times New... + IT EET 1 16 Coeficients Standardized Coeficients Unstandardized Coatidienis 3 SH Error 1 een 2.151 1046 2014 1209 104 12 12199 000 073 1111 0 0 co 025 128 199 eda * Dupersent valable corup Based on table the largest beta ccefficien: () is Motivation (6= $12, 2=0.000. p=0.05) which So explain about the work implication. This concludes that ar malies the strongest contribution to explaining the Employee Performance Daring Co-id-:9. when the vanance explained by all other variables in the model it controlled Dr. This is followed by ap - -211. p=0.037. P-0.05) xkere 104?: explain to the variance : EmplotePerformance during Covid-19. Next iti AB=.013, p= 10$, 3-0, con lettlains 2.50. is the t'ariance of Employee Portimence during Cardid:181Step by Step Solution
There are 3 Steps involved in it
1 Expert Approved Answer
Step: 1 Unlock

Question Has Been Solved by an Expert!
Get step-by-step solutions from verified subject matter experts
Step: 2 Unlock
Step: 3 Unlock