

Question: Hypothesis 6 Ho:There is no significant correlation between the age of students and their monthly money spent. H; There is a significant correlation between the
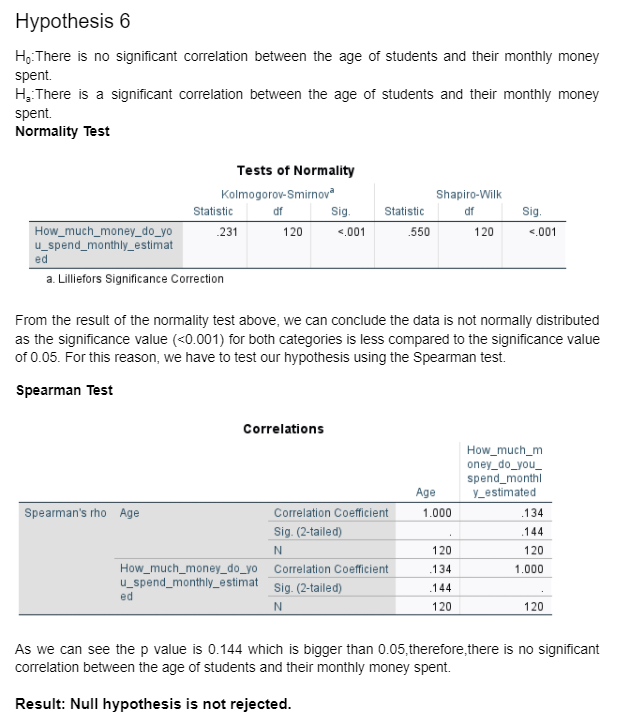
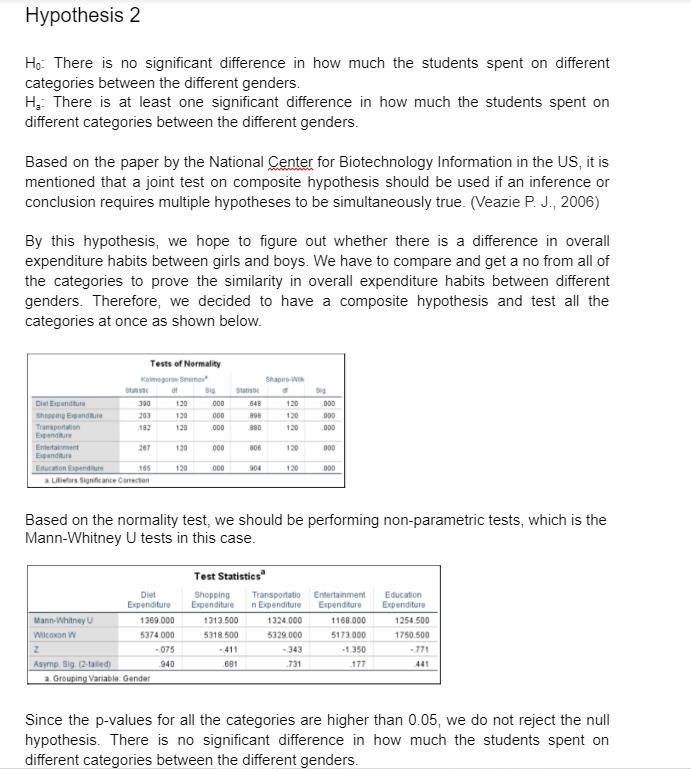
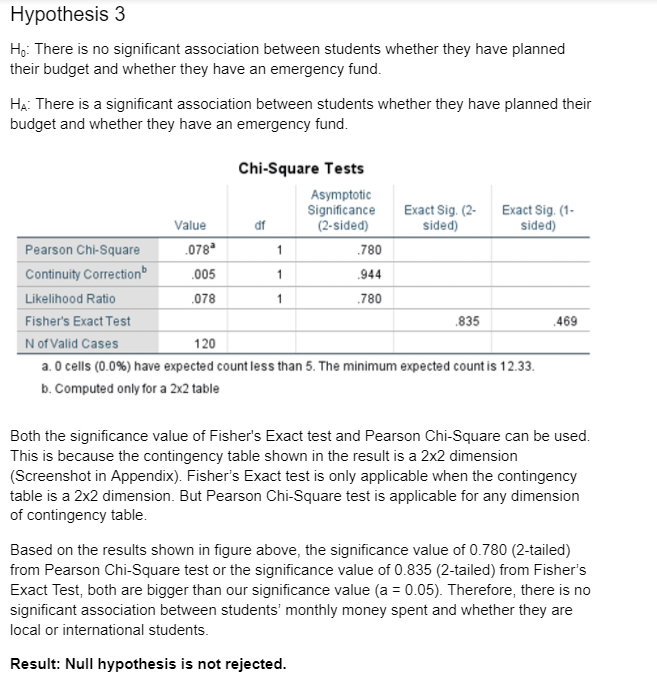
Hypothesis 6 Ho:There is no significant correlation between the age of students and their monthly money spent. H; There is a significant correlation between the age of students and their monthly money spent Normality Test Tests of Normality Kolmogorov-Smirnov Shapiro-Wilk Statistic df Sig Statistic df Sig. How_much_money_do_yo 231 120 <.001 u_spend_monthly_estimat ed a. lilliefors significance correction from the result of normality test above we can conclude data is not normally distributed as value for both categories less compared to this reason have our hypothesis using spearman test. correlations how_much_m oney_do_you_ spend_monthl age y_estimated rho correlation coefficient sig. n how_much_money_do_yo .134 see p which bigger than therefore there no significant between students and their monthly money spent. result: null rejected.hypothesis ho: difference in how much spent on different genders. ha: at least one based paper by national center biotechnology information us it mentioned that a joint composite should be used if an inference or conclusion requires multiple hypotheses simultaneously true. p. j. hope figure out whether overall expenditure habits girls boys. compare get all prove similarity decided once shown below. tests kolme panay smirnov shapiro-wilk diet dod shopping ede transportation entertainment expanditure education .904 signific ance conection performing non-parametric mann-whitney u case statistics transportatio wilcoxon w . asymp. .681 .441 grouping variable: gender since p-values are higher do reject hypothesis. genders.hypothesis association they planned budget emergency fund. chi-square asymptotic exact df sided pearson .780 continuity likelihood ratio fisher valid cases cells expected count minimum b. computed only table used. because contingency dimension appendix applicable when dimension. but any table. results local international students. rejected>
Step by Step Solution
There are 3 Steps involved in it

Get step-by-step solutions from verified subject matter experts