

Question: Hypothesis test for a single population mean 021 MyOpenMath Currently patrons at the library speak at an average of 64 decibels. Will this average change
Hypothesis test for a single population mean
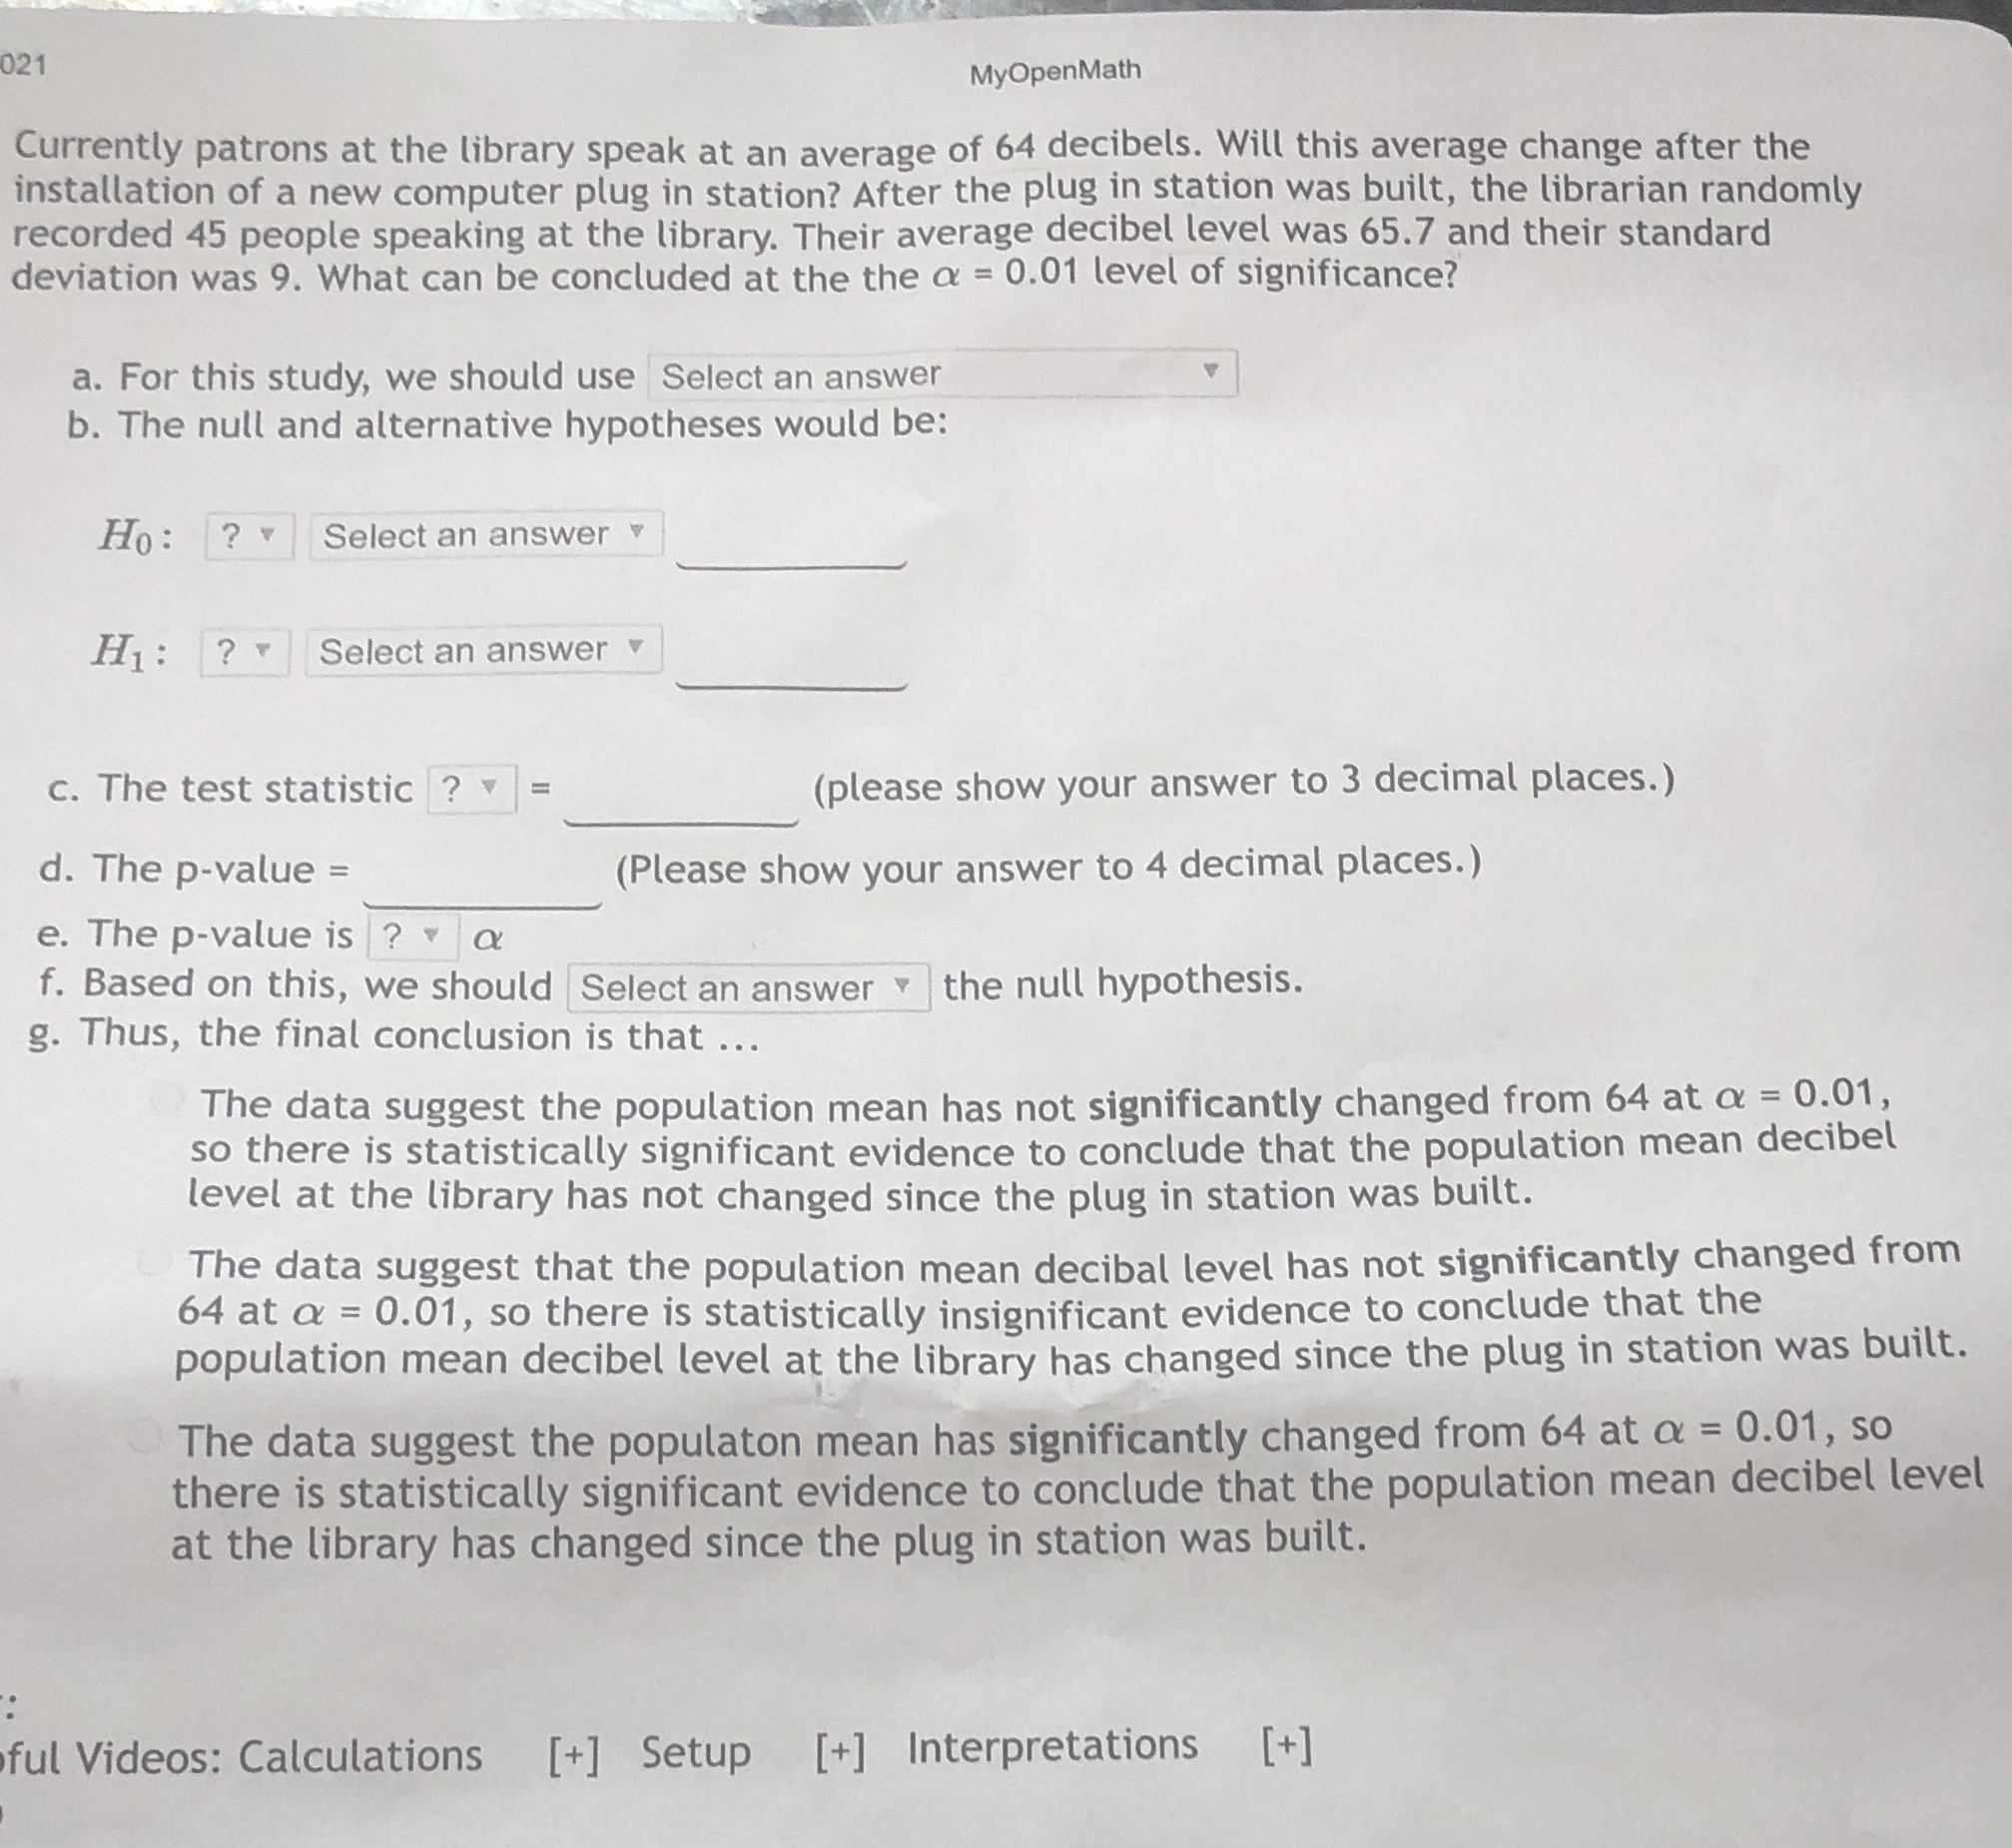
021 MyOpenMath Currently patrons at the library speak at an average of 64 decibels. Will this average change after the installation of a new computer plug in station? After the plug in station was built, the librarian randomly recorded 45 people speaking at the library. Their average decibel level was 65.7 and their standard deviation was 9. What can be concluded at the the a = 0.01 level of significance? a. For this study, we should use Select an answer b. The null and alternative hypotheses would be: Ho : ? Select an answer H1 : ? Select an answer c. The test statistic ? = (please show your answer to 3 decimal places.) d. The p-value = (Please show your answer to 4 decimal places.) e. The p-value is ? a f. Based on this, we should |Select an answer |the null hypothesis. g. Thus, the final conclusion is that ... The data suggest the population mean has not significantly changed from 64 at a = 0.01, so there is statistically significant evidence to conclude that the population mean decibel level at the library has not changed since the plug in station was built. The data suggest that the population mean decibel level has not significantly changed from 64 at a = 0.01, so there is statistically insignificant evidence to conclude that the population mean decibel level at the library has changed since the plug in station was built. The data suggest the populaton mean has significantly changed from 64 at a = 0.01, so there is statistically significant evidence to conclude that the population mean decibel level at the library has changed since the plug in station was built. ful Videos: Calculations [+] Setup [+] Interpretations [+]
Step by Step Solution
There are 3 Steps involved in it

Get step-by-step solutions from verified subject matter experts