

Question: Hypoxia is a well - documented microenvironmental factor contributing to drug resistance in cancer cells by upregulating various genes, including hypoxia - inducible factor l
Hypoxia is a welldocumented microenvironmental factor contributing to drug resistance in cancer cells by upregulating various genes, including hypoxiainducible factor lalpha HIFa HIFl activates survival pathways, making cancer cells less responsive to chemotherapy. To explore potential solutions, a novel drug candidate, GBE designed to counteract hypoxiamediated resistance, is being tested.
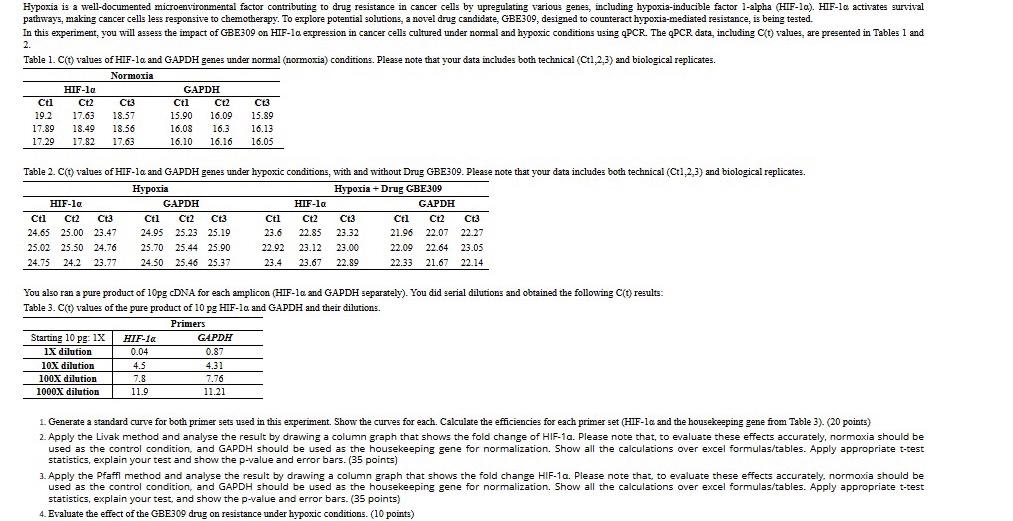
In this experiment, you will assess the impact of GBE on HFla expression in cancer cells cultured under normal and hypoxic conditions using qPCR The PCR data, including Ct values, are presented in Tables and
Table Ct values of HIFl and GAPDH genes under normal normoxia conditions. Please note that your data includes both technical Ct and biological replicates.
tableNormoxiaHIFlaGAPDH,CtCtCtCtCtCt
Table Ct values of HIFl and GAPDH genes under hypoxic conditions, with and without Drug GBE Please note that your data includes both technical Ct and biological replicates.
tableHypoxiaHypoxia Drug GBEHIFlaGAPDH,,HIFlaGAPDHCtCtCtCtCtCtCtlCtCtCtCtCt
You also ran a pure product of pg cDNA for each amplicon HIF and GAPDH separately You did serial dilutions and obtained the following Ct results:
Table Ct values of the pure product of pg HIFla and GAPDH and their dilutions.
tablePrimersStarting pg: XHIFaGAPDH dilution, dilution,X dilution, dilution,
Generate a standard curve for both primer sets used in this experiment. Show the curves for each. Calculate the efficiencies for each primer set HIFl and the housekeaping gene from Table points
Apply the Livak method and analyse the result by drawing a column graph that shows the fold change of HIFa Please note that, to evaluate these effects accurately, normoxia should be used as the control condition, and GAPDH should be used as the housekeeping gene for normalization. Show all the calculations over excel formulastables Apply appropriate ttest statistics, explain your test and show the pvalue and error bars. points
Apply the Pfaffl method and analyse the result by drawing a column graph that shows the fold change HIFa Please note that, to evaluate these effects accurately, normoxia should be used as the control condition, and GAPDH should be used as the housekeeping gene for normalization. Show all the calculations over excel formulastables Apply appropriate ttest statistics, explain your test, and show the pvalue and error bars. points
Evaluate the effect of the GBE drug on resistance under hypoxic conditions. points
Step by Step Solution
There are 3 Steps involved in it
1 Expert Approved Answer
Step: 1 Unlock

Question Has Been Solved by an Expert!
Get step-by-step solutions from verified subject matter experts
Step: 2 Unlock
Step: 3 Unlock