

Question: I 35 II )5 10 15 ill 5 Looking at graph above, select the TRUE statement concerning the data distribution shown in it. 0 A)
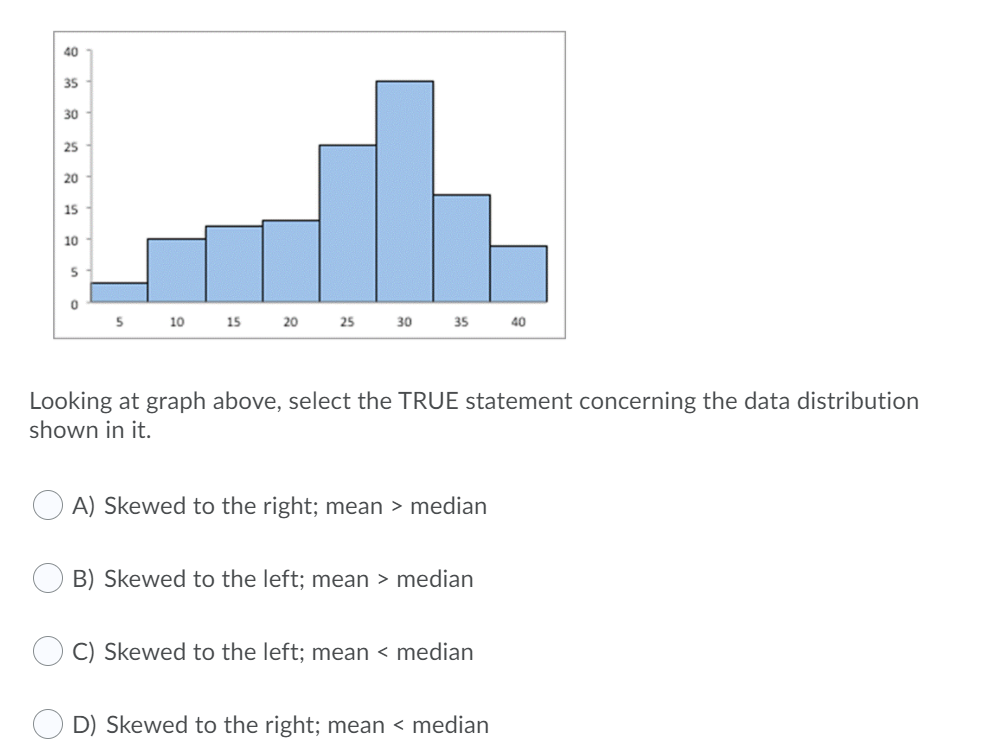

\"I 35 II )5 10 15 ill 5 Looking at graph above, select the TRUE statement concerning the data distribution shown in it. 0 A) Skewed to the right; mean > median O B) Skewed to the left; mean > median O C) Skewed to the left; mean
Step by Step Solution
There are 3 Steps involved in it
1 Expert Approved Answer
Step: 1 Unlock

Question Has Been Solved by an Expert!
Get step-by-step solutions from verified subject matter experts
Step: 2 Unlock
Step: 3 Unlock