

Question: i (a) Create a frequency distribution table with 8 classes from the following data. Include classes, frequencies, class midpoints, class boundaries, and relative frequencies as
i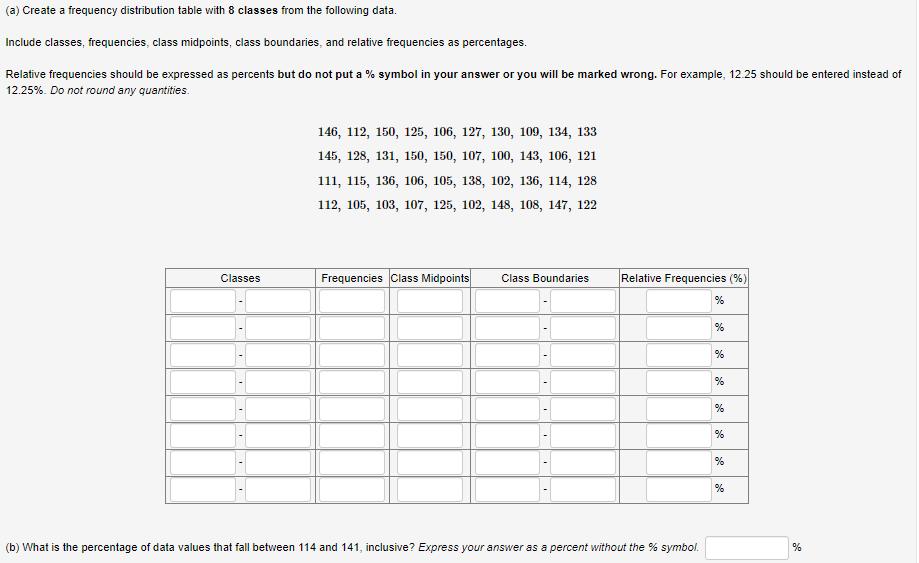
(a) Create a frequency distribution table with 8 classes from the following data. Include classes, frequencies, class midpoints, class boundaries, and relative frequencies as percentages. Relative frequencies should be expressed as percents but do not put a % symbol in your answer or you will be marked wrong. For example, 12.25 should be entered instead of 12.25%. Do not round any quantities. 146, 112, 150, 125, 106, 127, 130, 109, 134, 133 145, 128, 131, 150, 150, 107, 100, 143, 106, 121 111, 115, 136, 106, 105, 138, 102, 136, 114, 128 112, 105, 103, 107, 125, 102, 148, 108, 147, 122 Classes Frequencies Class Midpoints Class Boundaries Relative Frequencies (%) % % % % % % % % (b) What is the percentage of data values that fall between 114 and 141, inclusive? Express your answer as a percent without the % symbol. %
Step by Step Solution
There are 3 Steps involved in it
Solutions Step 1 The given data in increasing order is 105 106 110 111 111 112 112 114 116 116 117 1... View full answer

Get step-by-step solutions from verified subject matter experts