

Question: I a m working o n a n excel spreadsheet for managerial economics, help m e fill i t out Attached i s the image
I working excel spreadsheet for managerial economics, help fill out Attached the image the actual problem:
Here are the steps help:
Steps Perform:
Step Instructions Points Possible
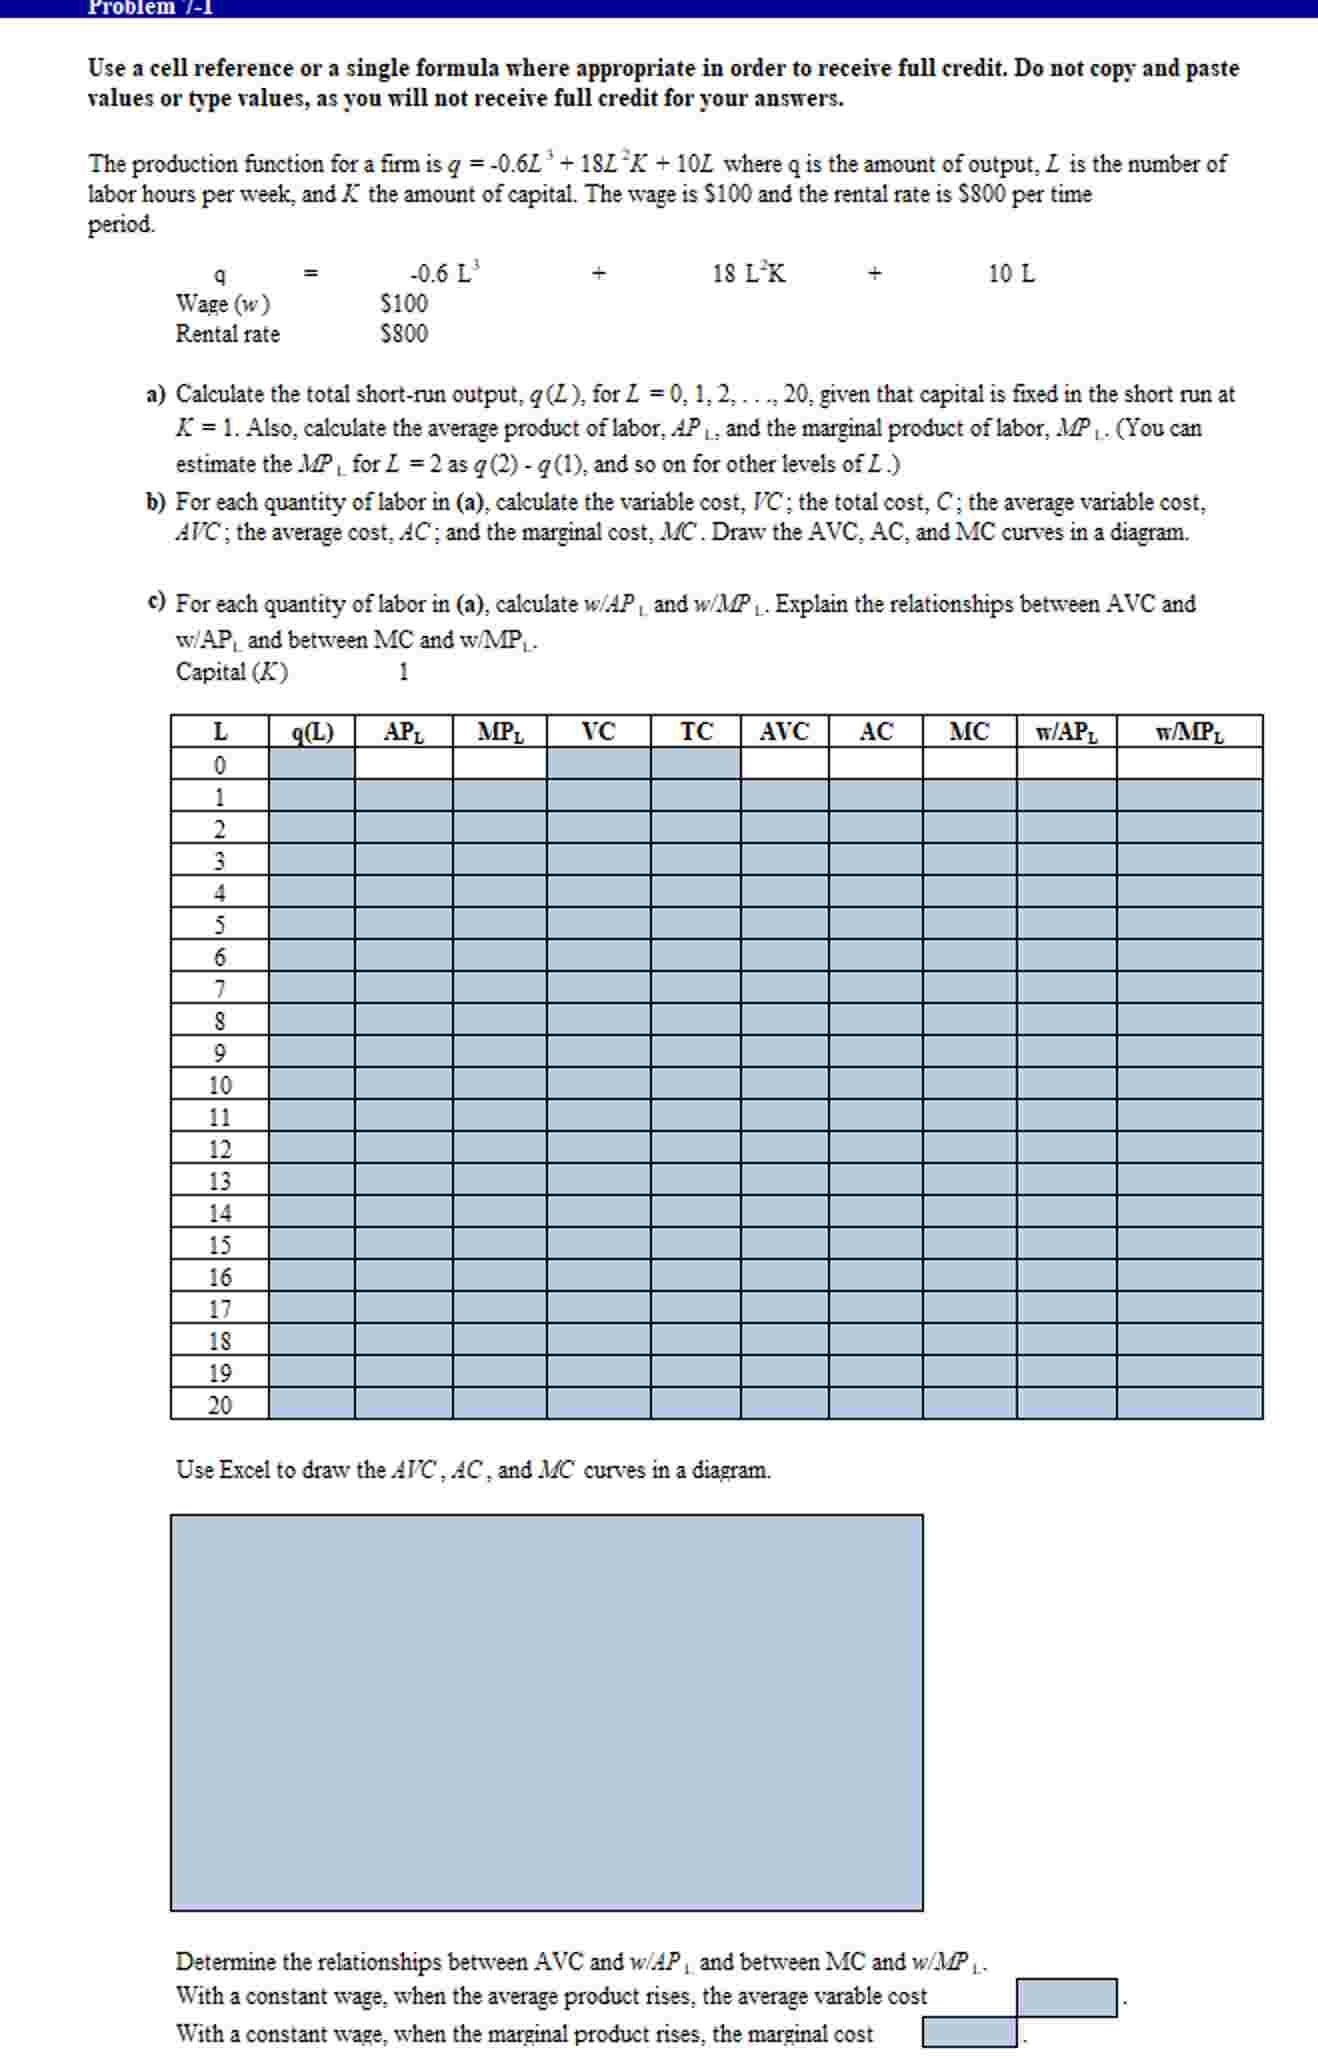
Use a cell reference a single formula where appropriate order receive full credit. not copy and paste values type values, you will not receive full credit for your answers.
Start Excel.
cell using relative and cell references, calculate the total shortrun output the labor level cell Copy the formula from cell down the column cell
cell using relative and cell references, calculate the average product labor the labor level cell Copy the formula from cell down the column cell
cell using cell references, calculate the marginal product labor for the labor level cell Copy the formula from cell down the column cell
cell using relative and cell references, calculate the variable cost the labor level cell Copy the formula from cell down the column cell
cell using relative and cell references, calculate the total cost the value the labor level cell Copy the formula from cell down the column cell
cell using cell references, calculate the average variable cost the labor level cell Copy the formula from cell down the column cell
cell using cell references, calculate the average cost the labor level cell Copy the formula from cell down the column cell
cell using cell references, calculate the marginal cost for the labor level cell the ratio the differences the point values. Copy the formula from cell down the column cell
cell using relative and cell references, calculate the ratio APL the labor level cell Copy the formula from cell down the column cell
cell using relative and cell references, calculate the ratio the labor level cell Copy the formula from cell down the column cell
cells insert a Scatter Chart for the average variable cost, the average cost, and the marginal cost.
Inserting a Chart
the Insert tab, the Charts group, click the arrow next Insert Scatter Bubble Chart and choose Scatter with Smooth Lines Chart.
Selecting Data Series
Then Select Data Source window, delete any series created automatically.
Add new series for the average variable cost curve using cells : for the values and cells : for the values. Use the series name.
Add new series for the average cost curve using cells : for the values and cells : for the values. Use the series name.
Add new series for the marginal cost curve using cells : for the values and cells : for the values. Use the series name.
Edit Chart Elements
Select design Style for the chart. the Add Chart Elements dropdown list the Design tab the Ribbon. Add Cost Curves the chart title. Add Output per week the title for the horizontal axis and Cost $ the title for the vertical axis.
Chart Position
Set the chart height and width the entire chart fits within cells
cell determine what happens with the average variable cost when the average product rises.
cell determine what happens with the marginal cost when the marginal product rises.
Save the workbook. Close the workbook and then exit Excel. Submit the workbook directed.
Step by Step Solution
There are 3 Steps involved in it
1 Expert Approved Answer
Step: 1 Unlock

Question Has Been Solved by an Expert!
Get step-by-step solutions from verified subject matter experts
Step: 2 Unlock
Step: 3 Unlock