

Question: I also need to find upper and lower for the R-chart, as well Refer to Table 56.1 - Factors for Computing Control Chart Limits (3
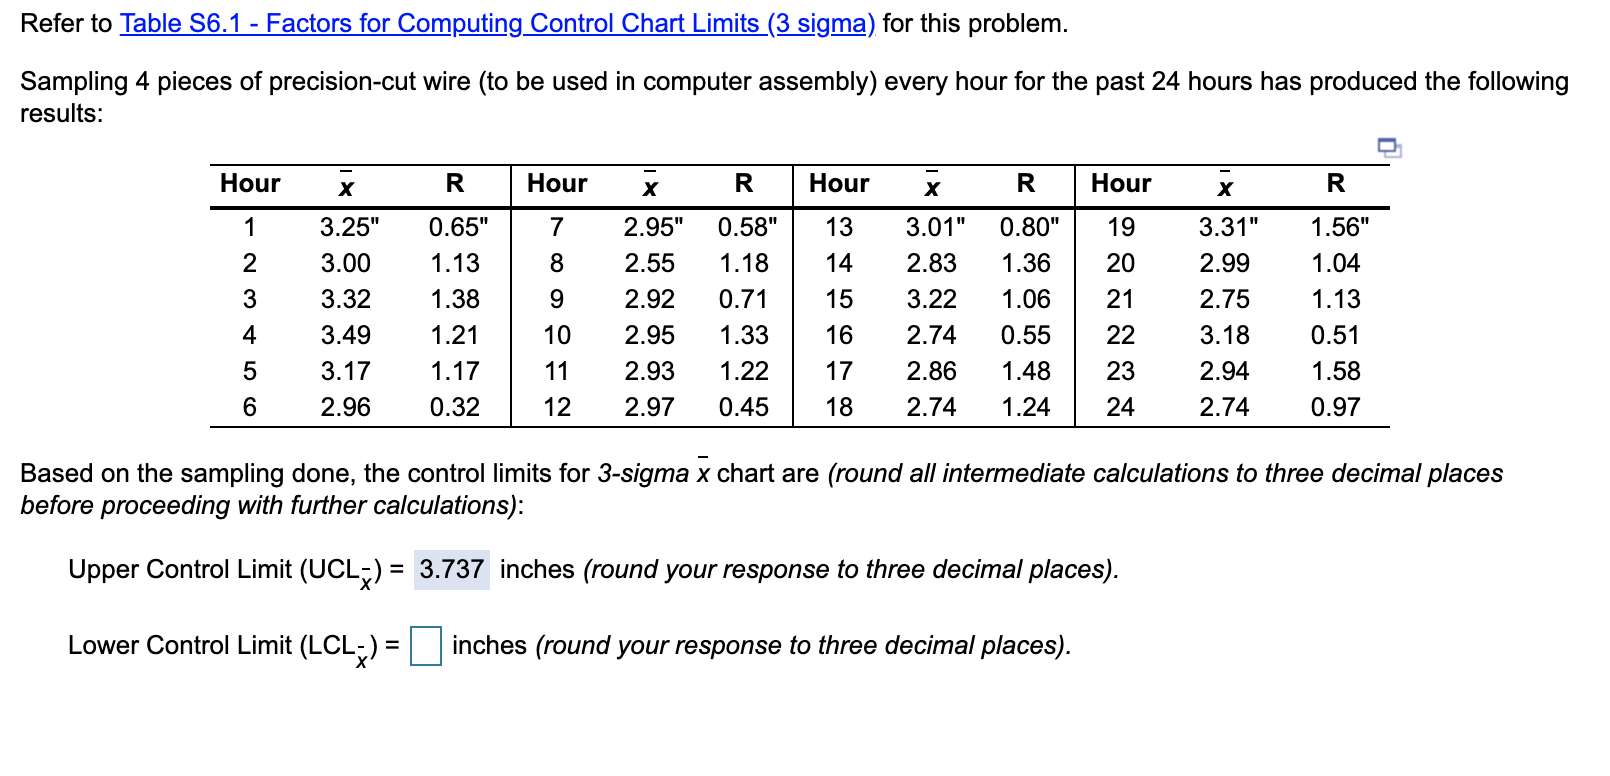 I also need to find upper and lower for the R-chart, as well
Step by Step Solution
There are 3 Steps involved in it
1 Expert Approved Answer
Step: 1 Unlock

Question Has Been Solved by an Expert!
Get step-by-step solutions from verified subject matter experts
Step: 2 Unlock
Step: 3 Unlock