

Question: *i always give THUMBS UP but please show work (: * news-vendor model This catalog/internet retailer must make a decision on how many -high end,
*i always give THUMBS UP but please show work (: *
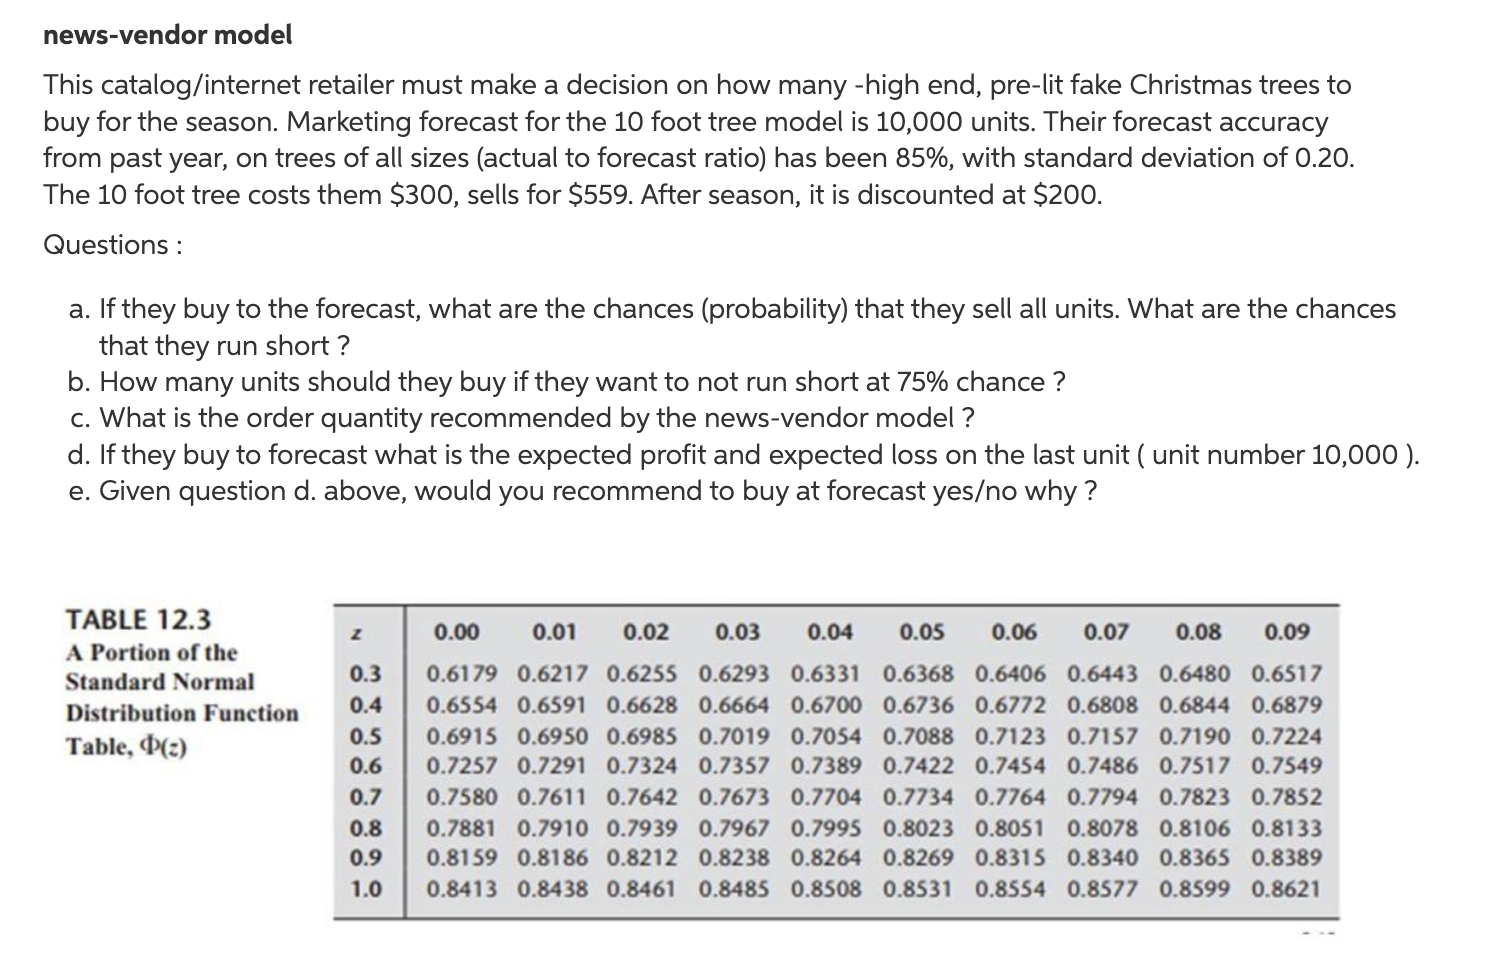
news-vendor model This catalog/internet retailer must make a decision on how many -high end, pre-lit fake Christmas trees to buy for the season. Marketing forecast for the 10 foot tree model is 10,000 units. Their forecast accuracy from past year, on trees of all sizes (actual to forecast ratio) has been 85%, with standard deviation of 0.20. The 10 foot tree costs them $300, sells for $559. After season, it is discounted at $200. Questions : a. If they buy to the forecast, what are the chances (probability) that they sell all units. What are the chances that they run short ? b. How many units should they buy if they want to not run short at 75% chance? c. What is the order quantity recommended by the news-vendor model ? d. If they buy to forecast what is the expected profit and expected loss on the last unit ( unit number 10,000). e. Given question d. above, would you recommend to buy at forecast yeso why? Z 0.01 0.03 0.04 TABLE 12.3 A Portion of the Standard Normal Distribution Function Table, (z) 0.3 0.4 0.5 0.6 0.00 0.02 0.05 0.06 0.07 0.08 0.09 0.6179 0.6217 0.6255 0.6293 0.6331 0.6368 0.6406 0.6443 0.6480 0.6517 0.6554 0.6591 0.6628 0.6664 0.6700 0.6736 0.6772 0.6808 0.6844 0.6879 0.6915 0.6950 0.6985 0.7019 0.7054 0.7088 0.7123 0.7157 0.7190 0.7224 0.7257 0.7291 0.7324 0.7357 0.7389 0.7422 0.7454 0.7486 0.7517 0.7549 0.7580 0.7611 0.7642 0.7673 0.7704 0.7734 0.7764 0.7794 0.7823 0.7852 0.7881 0.7910 0.7939 0.7967 0.7995 0.8023 0.8051 0.8078 0.8106 0.8133 0.8159 0.8186 0.8212 0.8238 0.8264 0.8269 0.8315 0.8340 0.8365 0.8389 0.8413 0.8438 0.8461 0.8485 0.8508 0.8531 0.8554 0.8577 0.8599 0.8621 0.7 0.8 0.9 1.0 news-vendor model This catalog/internet retailer must make a decision on how many -high end, pre-lit fake Christmas trees to buy for the season. Marketing forecast for the 10 foot tree model is 10,000 units. Their forecast accuracy from past year, on trees of all sizes (actual to forecast ratio) has been 85%, with standard deviation of 0.20. The 10 foot tree costs them $300, sells for $559. After season, it is discounted at $200. Questions : a. If they buy to the forecast, what are the chances (probability) that they sell all units. What are the chances that they run short ? b. How many units should they buy if they want to not run short at 75% chance? c. What is the order quantity recommended by the news-vendor model ? d. If they buy to forecast what is the expected profit and expected loss on the last unit ( unit number 10,000). e. Given question d. above, would you recommend to buy at forecast yeso why? Z 0.01 0.03 0.04 TABLE 12.3 A Portion of the Standard Normal Distribution Function Table, (z) 0.3 0.4 0.5 0.6 0.00 0.02 0.05 0.06 0.07 0.08 0.09 0.6179 0.6217 0.6255 0.6293 0.6331 0.6368 0.6406 0.6443 0.6480 0.6517 0.6554 0.6591 0.6628 0.6664 0.6700 0.6736 0.6772 0.6808 0.6844 0.6879 0.6915 0.6950 0.6985 0.7019 0.7054 0.7088 0.7123 0.7157 0.7190 0.7224 0.7257 0.7291 0.7324 0.7357 0.7389 0.7422 0.7454 0.7486 0.7517 0.7549 0.7580 0.7611 0.7642 0.7673 0.7704 0.7734 0.7764 0.7794 0.7823 0.7852 0.7881 0.7910 0.7939 0.7967 0.7995 0.8023 0.8051 0.8078 0.8106 0.8133 0.8159 0.8186 0.8212 0.8238 0.8264 0.8269 0.8315 0.8340 0.8365 0.8389 0.8413 0.8438 0.8461 0.8485 0.8508 0.8531 0.8554 0.8577 0.8599 0.8621 0.7 0.8 0.9 1.0
Step by Step Solution
There are 3 Steps involved in it

Get step-by-step solutions from verified subject matter experts