

Question: I am doing a stats project on the hypothesis: Are vegans healthier than nonvegans.. I've made a scatterplot and computed all the data to get
I am doing a stats project on the hypothesis: Are vegans healthier than nonvegans..
I've made a scatterplot and computed all the data to get these answers.
I am still confused on how to explain the correlation between age and weight by discussing the data below.
I know all the excel work and formulas...
i just don't understand what correlation coefficient is, what the linear regression means, and what interpolation and extrapolation have to do with the chart. please explain!!! (:
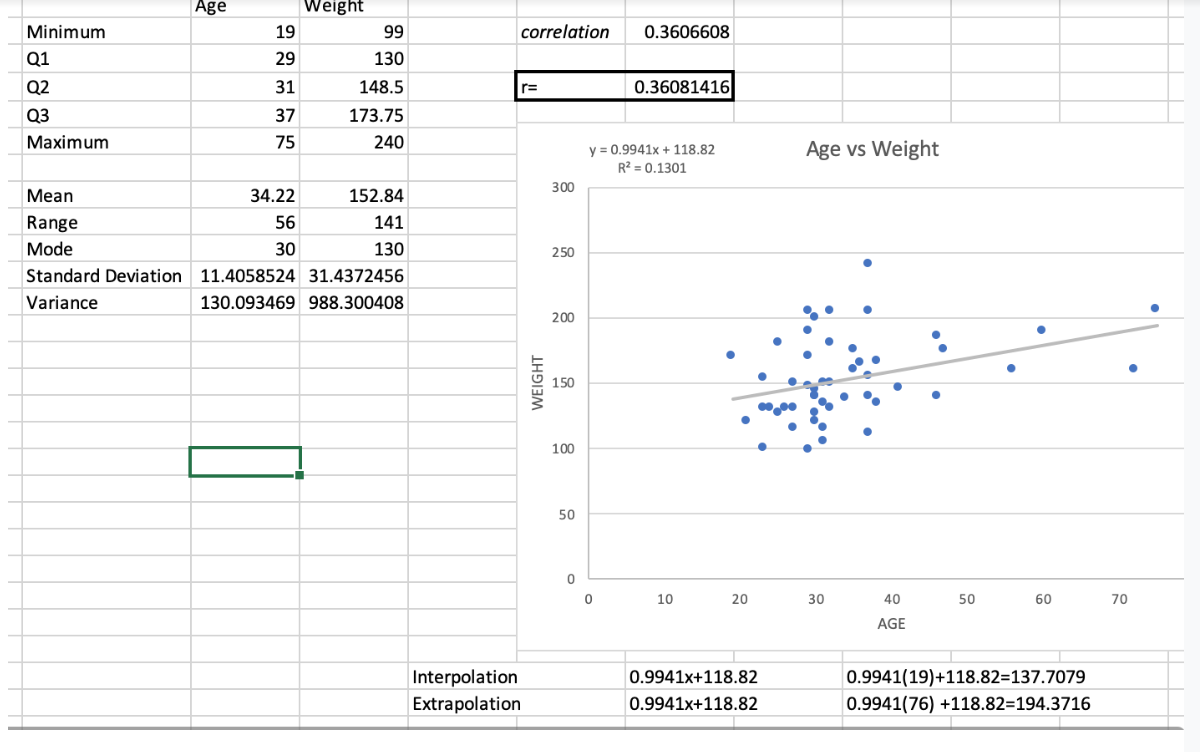
Age Weight Minimum 19 99 correlation 0.3606608 Q1 29 130 Q2 31 148.5 = 0.36081416 Q3 37 173.75 Maximum 75 240 y = 0.9941x + 118.82 R? = 0.1301 Age vs Weight Mean 34.22 152.84 300 Range 56 141 Mode 30 130 250 Standard Deviation 11.4058524 31.4372456 Variance 130.093469 988.300408 200 . . . WEIGHT 150 100 50 0 10 20 30 40 50 60 70 AGE Interpolation 0.9941x+118.82 0.9941(19)+118.82=137.7079 Extrapolation 0.9941x+118.82 0.9941(76) +118.82=194.3716
Step by Step Solution
There are 3 Steps involved in it

Get step-by-step solutions from verified subject matter experts