

Question: I am having a hard time finding total assets for 2013 to find average total assets between 13-14. Please show how to find this, Thanks!
I am having a hard time finding total assets for 2013 to find average total assets between 13-14. Please show how to find this, Thanks!
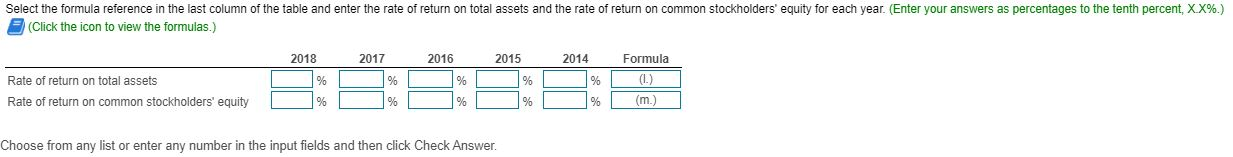
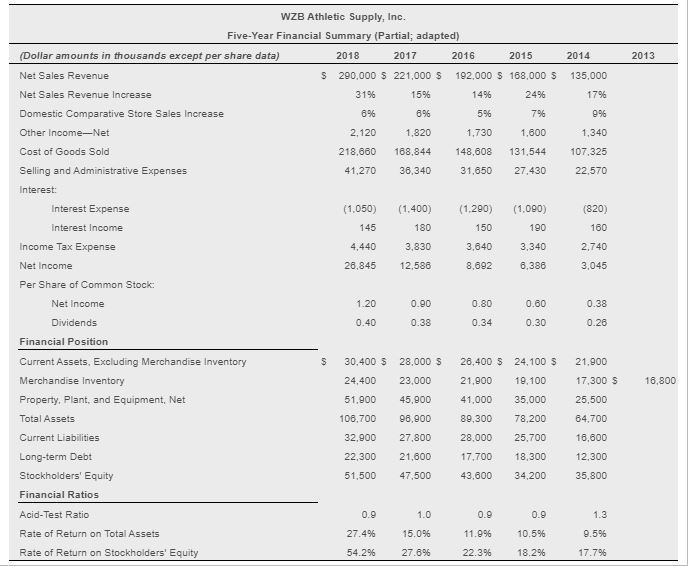
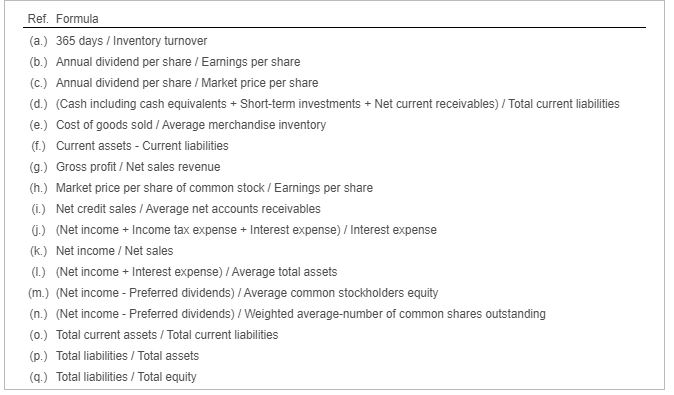
Select the formula reference in the last column of the table and enter the rate of return on total assets and the rate of return on common stockholders' equity for each year. (Enter your answers as percentages to the tenth percent, XX%.) (Click the icon to view the formulas.) 2018 2017 2016 2015 2014 Formula % % % Rate of return on total assets Rate of return on common stockholders' equity % % % (m.) Choose from any list or enter any number in the input fields and then click Check Answer. 2014 2013 135,000 17% 99% 1,340 107,325 22.570 (820) 160 2,740 WZB Athletic Supply, Inc. Five-Year Financial Summary (Partial; adapted) (Dollar amounts in thousands except per share data) 2018 2017 2016 2015 Net Sales Revenue $ 290,000 $ 221,000 $ 192.000 $ 168,000 $ Net Sales Revenue Increase 31% 15% 1496 2496 Domestic Comparative Store Sales Increase 89% 896 5% 79% Other Income,Net 2,120 1.820 1,730 1,600 Cost of Goods Sold 218,660 188,844 148,608 131,544 Selling and Administrative Expenses 41,270 36,340 31.650 27.430 Interest: Interest Expense (1.050) (1.400) (1.290) (1.090) Interest Income 145 180 150 190 Income Tax Expense 4.440 3,830 3,640 3,340 Net Income 26,845 12.586 8,692 6,386 Per Share of Common Stock: Net Income 1.20 0.90 0.80 0.60 Dividends 0.40 0.38 0.34 0.30 Financial Position Current Assets, Excluding Merchandise Inventory $ 30.400 $ 28.000 S 26,400 $ 24,100 S Merchandise Inventory 24,400 23.000 21,900 19,100 Property. Plant, and Equipment, Net 51.900 45,800 41.000 35,000 Total Assets 106.700 96.900 89,300 78.200 Current Liabilities 32.900 27.800 28.000 25.700 Long-term Debt 22.300 21,600 17,700 18,300 Stockholders' Equity 51,500 47.500 43.600 34,200 Financial Ratios 3,045 0.38 0.26 21.900 17,300 S 16,800 25,500 64,700 16,600 12,300 35,800 Acid-Test Ratio 0.9 1.0 0.9 0.9 1.3 Rate of Return on Total Assets 27.4% 15.0% 11.99 10.596 9.5% Rate of Return on Stockholders' Equity 54.296 27.6% 22.3% 18.2% 17.7% Ref. Formula (a.) 365 days / Inventory turnover (6.) Annual dividend per share / Earnings per share (C.) Annual dividend per share / Market price per share (d.) (Cash including cash equivalents + Short-term investments + Net current receivables) / Total current liabilities (e.) Cost of goods sold / Average merchandise inventory (1) Current assets - Current liabilities (9.) Gross profit / Net sales revenue (n.) Market price per share of common stock /Earnings per share () Net credit sales / Average net accounts receivables 0.) (Net income + Income tax expense + Interest expense) / Interest expense (k.) Net income / Net sales (L.) (Net income + Interest expense) / Average total assets (m.) (Net income - Preferred dividends) / Average common stockholders equity (n.) (Net income - Preferred dividends)/Weighted average-number of common shares outstanding (0.) Total current assets / Total current liabilities (p.) Total liabilities / Total assets (9.) Total liabilities/Total equity
Step by Step Solution
There are 3 Steps involved in it

Get step-by-step solutions from verified subject matter experts