

Question: I am having a tough time calculating multiple regression on the relationship between hospital costs and patient age, risk factors, and patient satisfaction scores, and
I am having a tough time calculating multiple regression on the relationship between hospital costs and patient age, risk factors, and patient satisfaction scores, and then generating a prediction to support this.
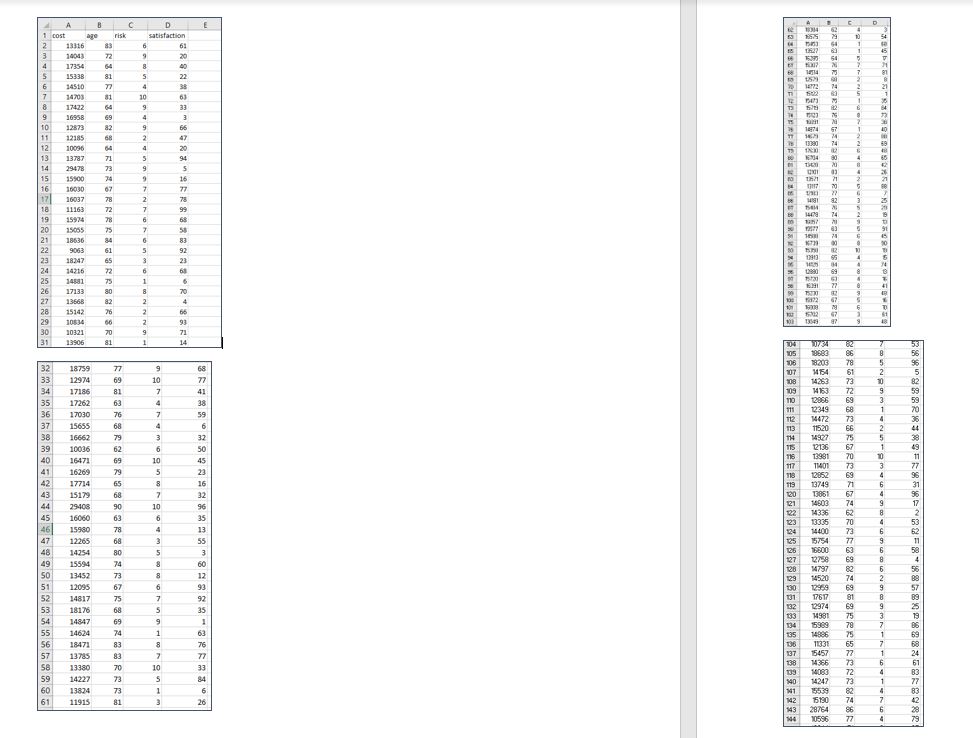
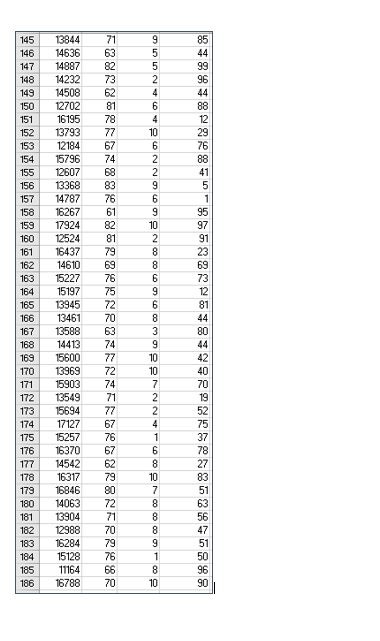
My numbers are incorrect. I have the data for readmission, but I don't know the correct number to calculate. I have to use the information on hospital discharges from last year and perform multiple regression on the relationship between hospital costs and patient age, risk factors, and patient satisfaction scores, and then generate a prediction to support this health care decision. Please see attached. How do I perform these
multiple regressions correctly?
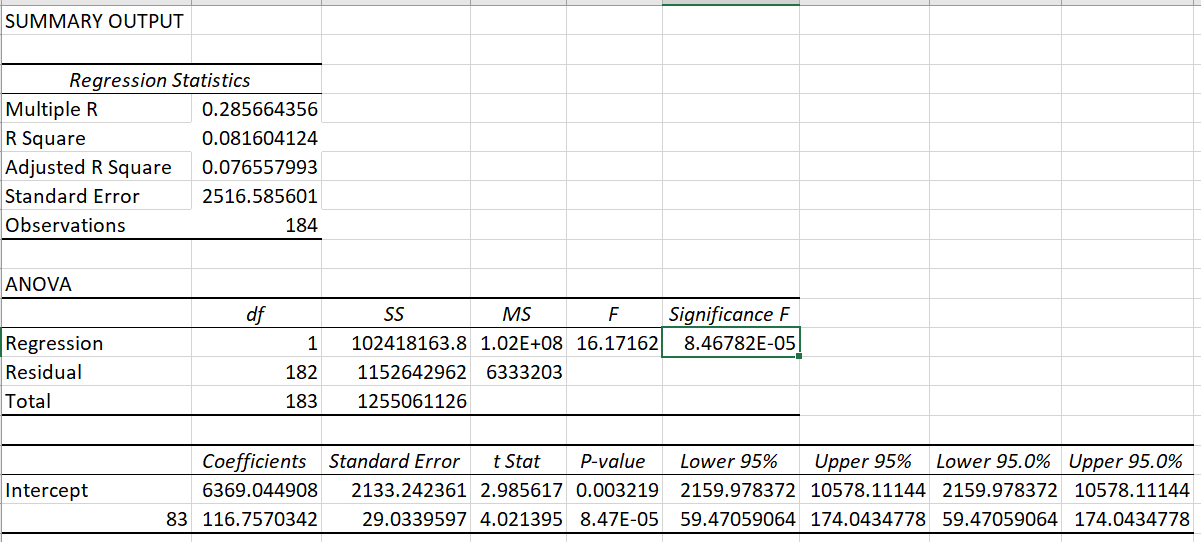
\f\fSUMMARY OUTPUT Regression Statistics Multiple R 0.285664356 R Square 0.081604124 Adjusted R Square 0.076557993 Standard Error 2516.585601 Observations 184 ANOVA df SS MS F Significance F Regression 1 102418163.8 1.02E+08 16.17162 8.46782E-05 Residual 182 1152642962 6333203 Total 183 1255061126 Coefficients Standard Error t Stat P-value Lower 95% Upper 95% Lower 95.0% Upper 95.0% Intercept 6369.044908 2133.242361 2.985617 0.003219 2159.978372 10578.11144 2159.978372 10578.11144 83 116.7570342 29.0339597 4.021395 8.47E-05 59.47059064 174.0434778 59.47059064 174.0434778
Step by Step Solution
There are 3 Steps involved in it

Get step-by-step solutions from verified subject matter experts