

Question: I am having trouble with a question for an assignment that I am working on for a class. Here is the assignment: Scenario The potential
I am having trouble with a question for an assignment that I am working on for a class.
Here is the assignment: Scenario
The potential for corporate fraud is always a consideration when using or even adopting an AIS. Even simple tools like Excel are useful in drawing information from accounting records found in an AIS. S&S is not exempted from this concern. Although this is not a normal duty for you, Ashton has asked you to analyze sales data for its stores. He expects this task will pay dividends later as you evaluate AIS solution controls. He did not share any expenses or specific fraud data.
Instructions
Update the Historical Sales Data Download Historical Sales Datafile to generate a descriptive status of sales and fraud data.
Do the following:
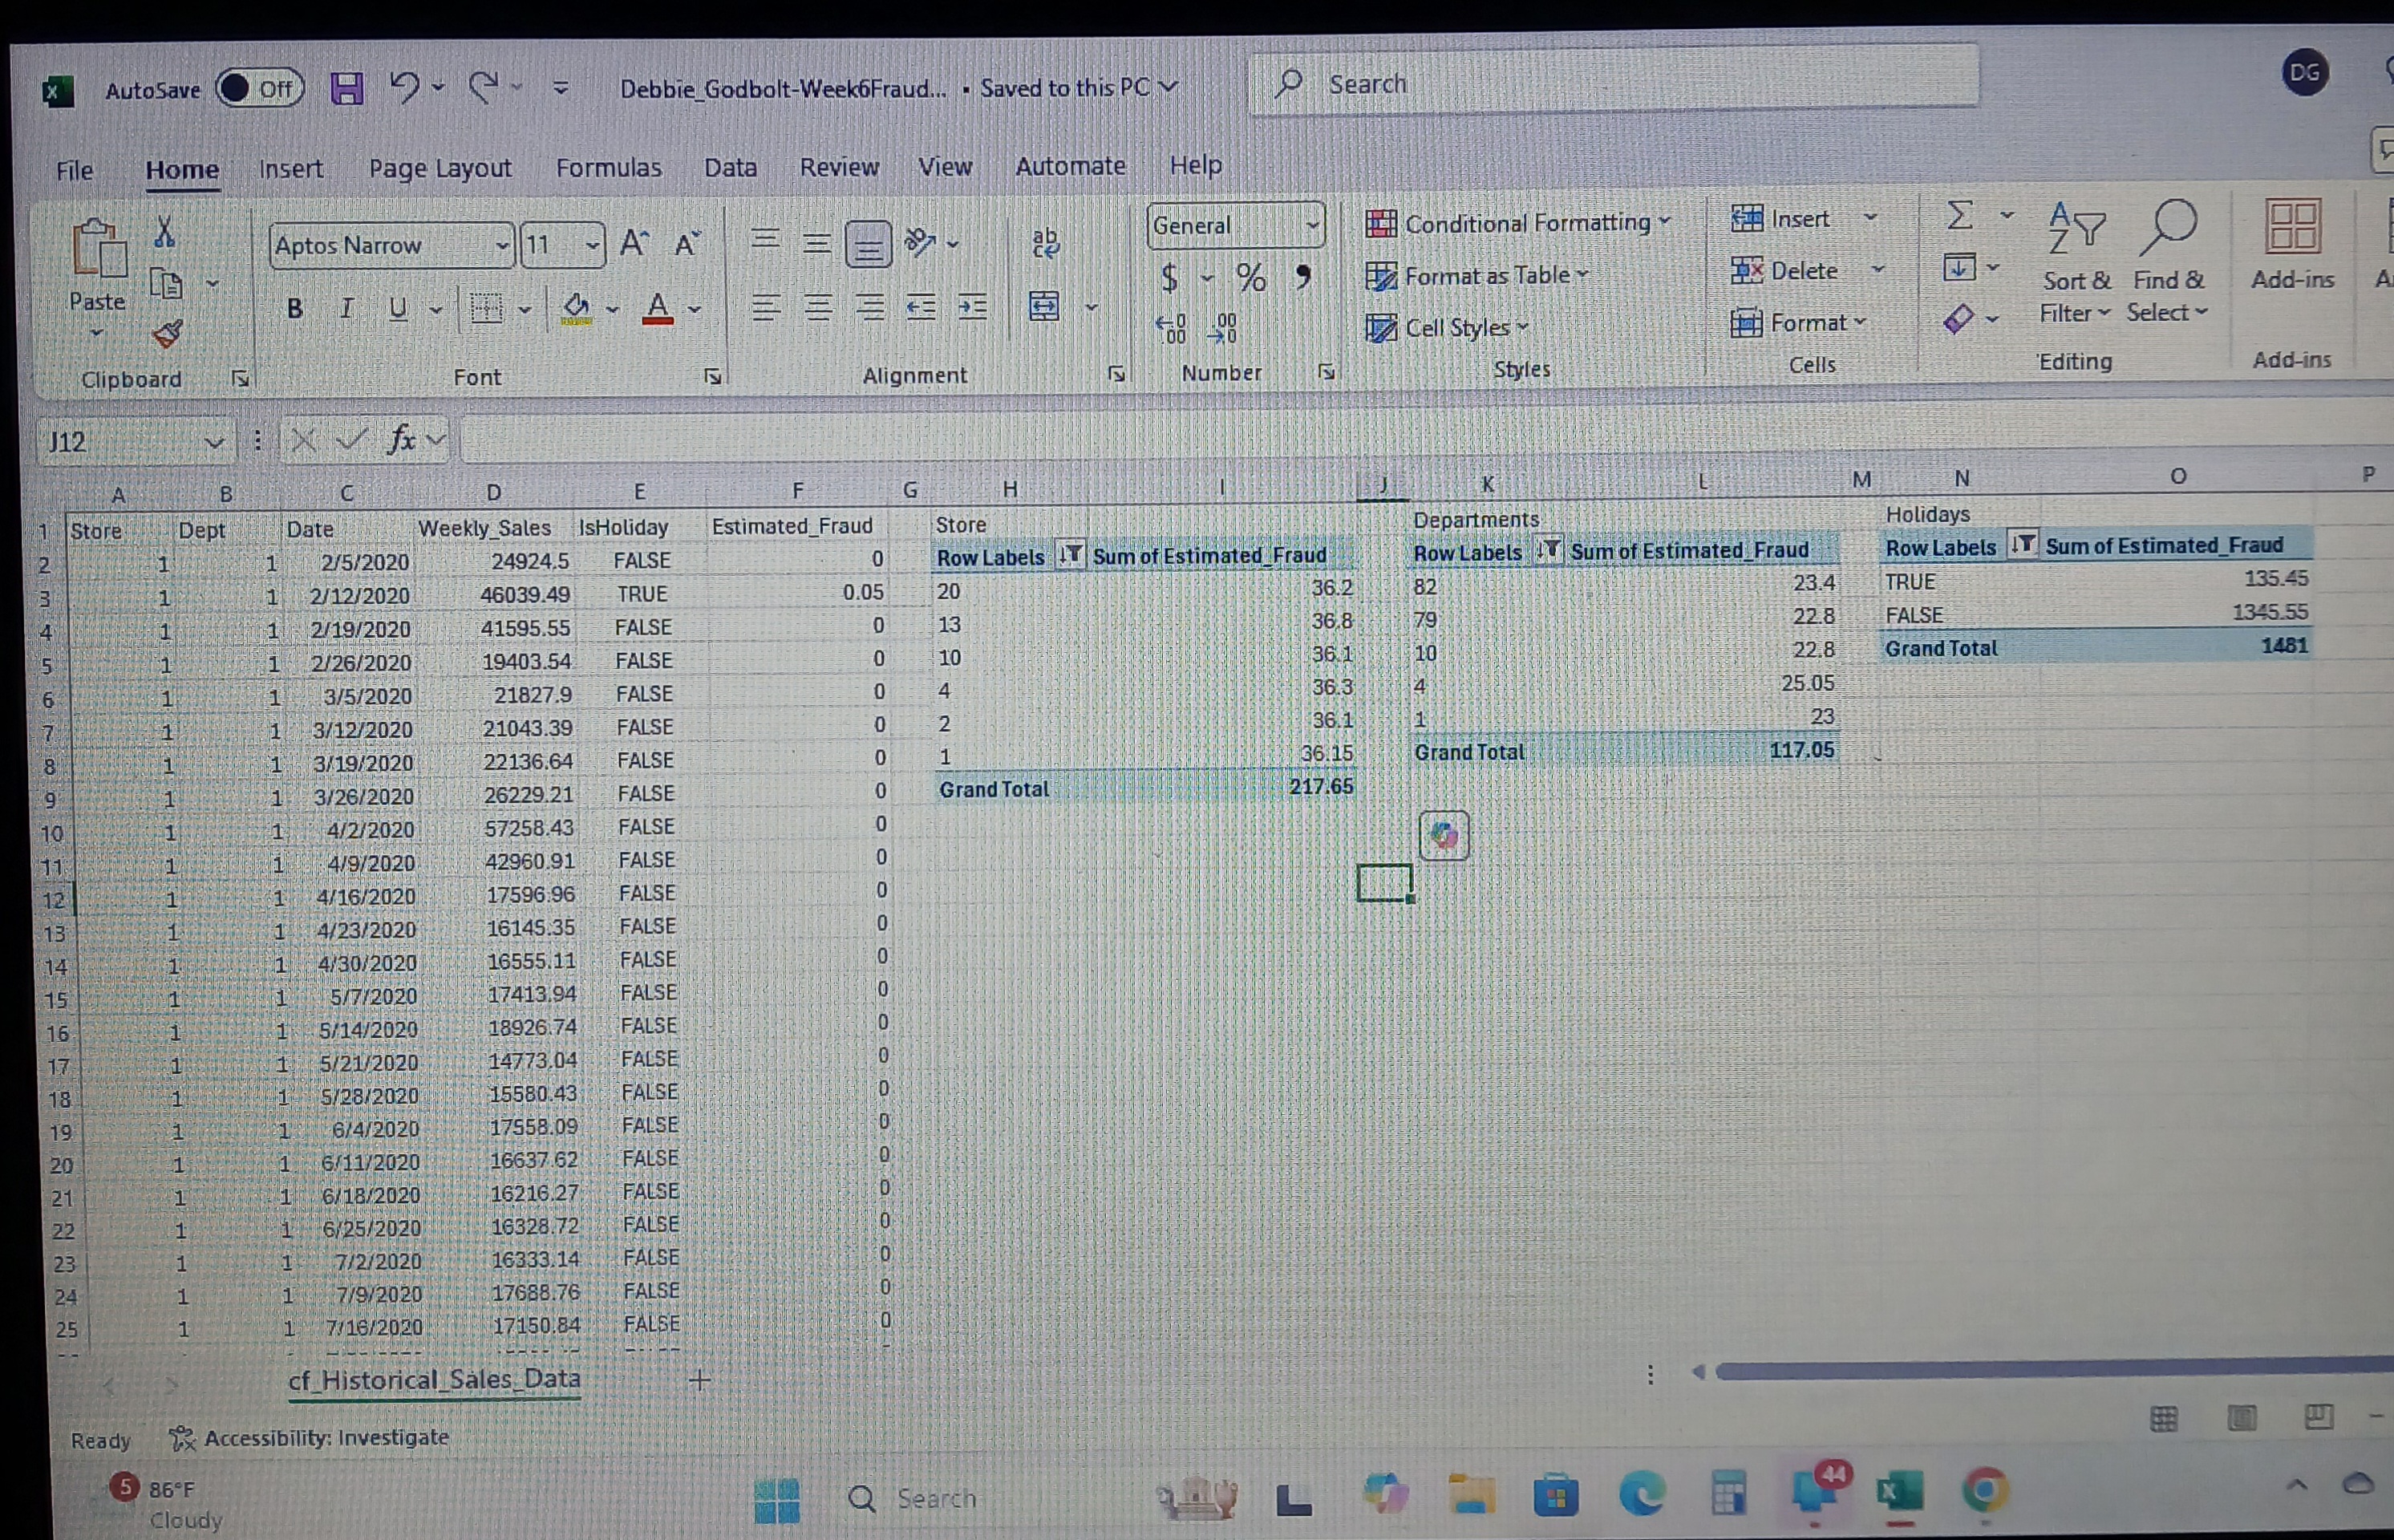
- In Column F, Row 1, add the title "Estimated_Fraud"
- Develop a formula that calculates fraud expenses at 5 % of weekly sales.
- Generate a descriptive status of sales and fraud data. You will store the results in a separate workbook.
- Develop pivot tables that identify the following:
- Top 5 stores with estimated fraudulent expenses.
- Top 5 departments with estimated fraudulent expenses.
- Top 5 holidays with estimated fraudulent expenses.
- Here is some of the Excel Workbook that I am trying to do:
Step by Step Solution
There are 3 Steps involved in it
Got you From your screenshot I can see why the numbers look offonly one row in EstimatedFraud shows 005 which means the sheet is not actually multiplying WeeklySales by 5 Lets fix that and then build ... View full answer

Get step-by-step solutions from verified subject matter experts