

Question: I am learning about hypothesis testing and p-values and would like to try and use the statistical data stated in the paper to perform the


I am learning about hypothesis testing and p-values and would like to try and use the statistical data stated in the paper to perform the hypothesis test myself. Please perform a t-test or another appropriate hypothesis test in excel with formulas provided based on the statistical data provided in this article. Thanks
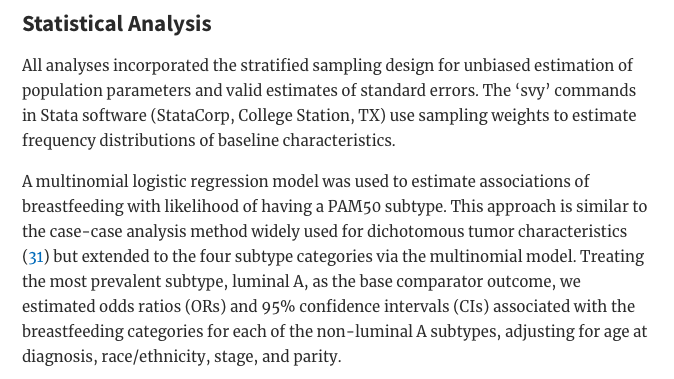
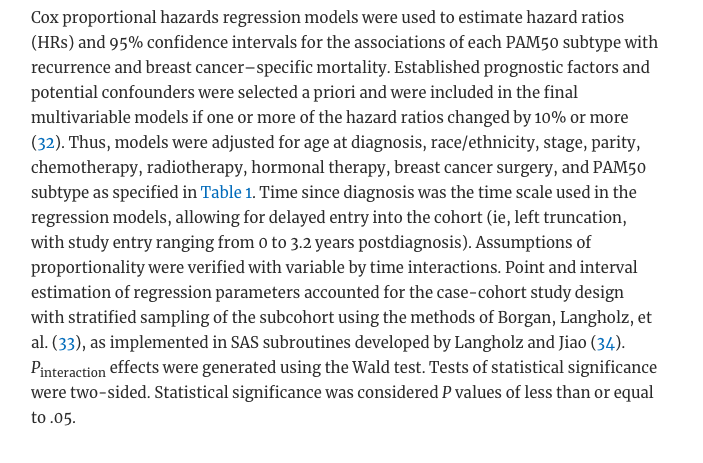

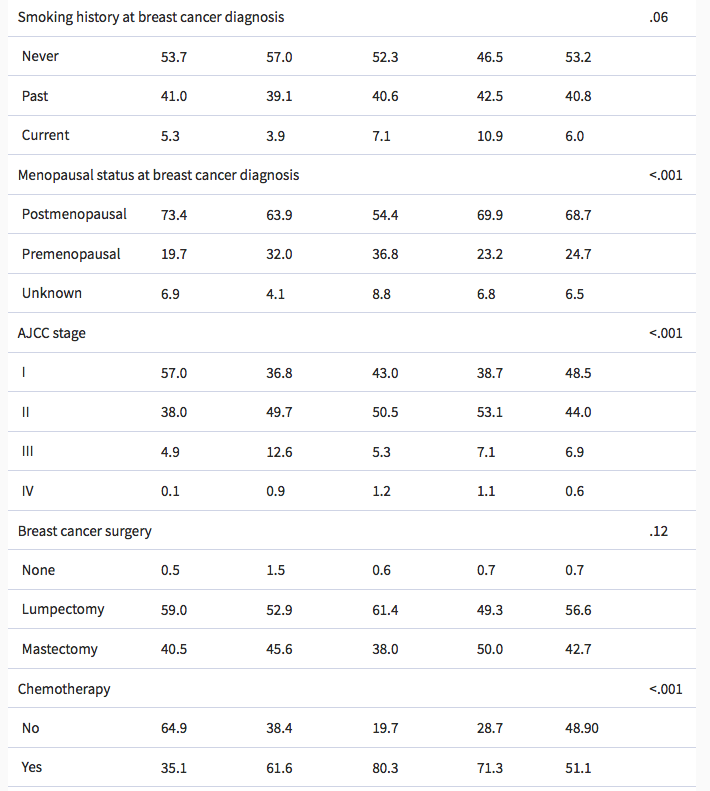
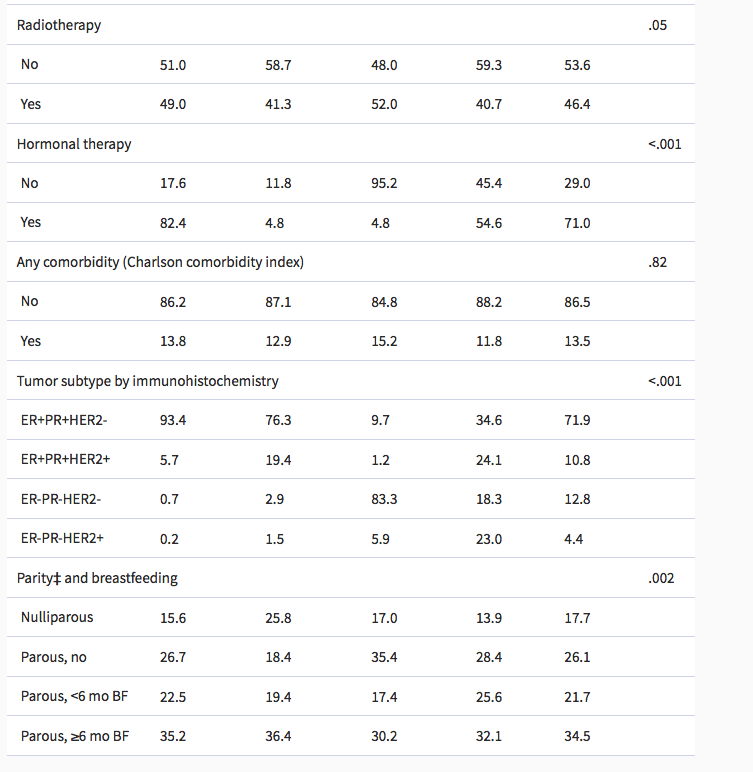
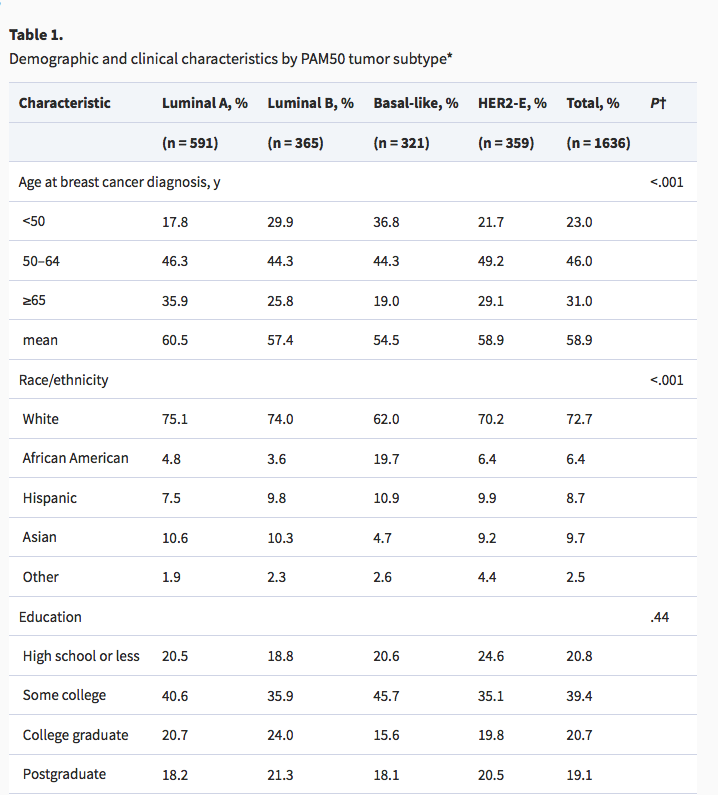
Statistical Analysis All analyses incorporated the stratified sampling design for unbiased estimation of population parameters and valid estimates of standard errors. The 'svy' commands in Stata software (StataCorp, College Station, TX) use sampling weights to estimate frequency distributions of baseline characteristics. A multinomial logistic regression model was used to estimate associations of breastfeeding with likelihood of having a PAM50 subtype. This approach is similar to the case-case analysis method widely used for dichotomous tumor characteristics (31) but extended to the four subtype categories via the multinomial model. Treating the most prevalent subtype, luminal A, as the base comparator outcome, we estimated odds ratios (ORs) and 95% confidence intervals (CIs) associated with the breastfeeding categories for each of the non-luminal A subtypes, adjusting for age at diagnosis, race/ethnicity, stage, and parity.Cox proportional hazards regression models were used to estimate hazard ratios (HRs) and 95% confidence intervals for the associations of each PAM50 subtype with recurrence and breast cancer-specific mortality. Established prognostic factors and potential confounders were selected a priori and were included in the final multivariable models if one or more of the hazard ratios changed by 10% or more (32). Thus, models were adjusted for age at diagnosis, race/ethnicity, stage, parity, chemotherapy, radiotherapy, hormonal therapy, breast cancer surgery, and PAM50 subtype as specified in Table 1. Time since diagnosis was the time scale used in the regression models, allowing for delayed entry into the cohort (ie, left truncation, with study entry ranging from o to 3.2 years postdiagnosis). Assumptions of proportionality were verified with variable by time interactions. Point and interval estimation of regression parameters accounted for the case-cohort study design with stratified sampling of the subcohort using the methods of Borgan, Langholz, et al. (33), as implemented in SAS subroutines developed by Langholz and Jiao (34). Pinteraction effects were generated using the Wald test. Tests of statistical significance were two-sided. Statistical significance was considered P values of less than or equal to .05.Table 1. Demographic and clinical characteristics by PAM50 tumor subtype* Characteristic Luminal A, % Luminal B, % Basal-like, % HER2-E, % Total, % Pt (n = 591) (n =365) (n = 321) (n =359) (n = 1636) Age at breast cancer diagnosis, y <.001 mean race white african american hispanic asian other education .44 high school or less some college graduate postgraduate history at breast cancer diagnosis .06 never past current menopausal status postmenopausal premenopausal unknown ajcc stage iv surgery .12 none lumpectomy mastectomy chemotherapy no yes .05 hormonal therapy any comorbidity index .82 tumor subtype by immunohistochemistry er er-pr-her2- er-pr-her2 parity and breastfeeding nulliparous parous mo bf>
Step by Step Solution
There are 3 Steps involved in it

Get step-by-step solutions from verified subject matter experts