

Question: I am looking for my python script to be interpreted, therefore, please address the following items: Define the null and alternative hypothesis in mathematical terms
I am looking for my python script to be interpreted, therefore, please address the following items:
- Define the null and alternative hypothesis in mathematical terms and in words.
- Report the level of significance.
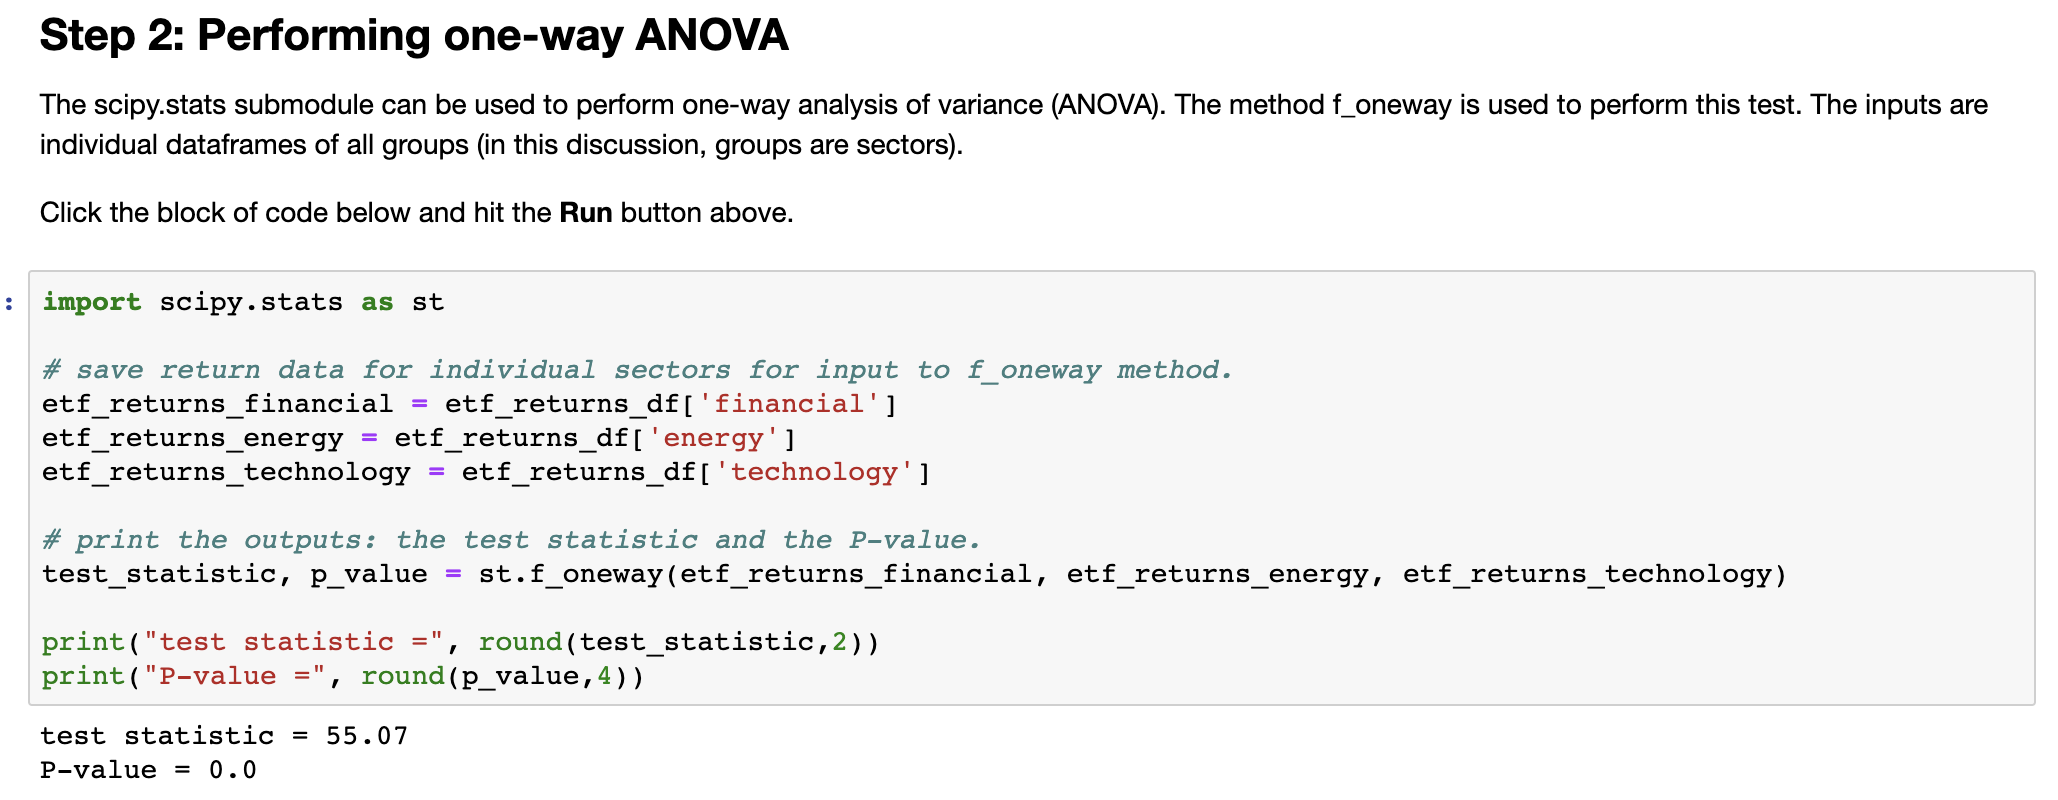
- Include the test statistic and the P-value. See Step 2 in the Python script.
- Provide your conclusion and interpretation of the test. Should the null hypothesis be rejected? Why or why not?
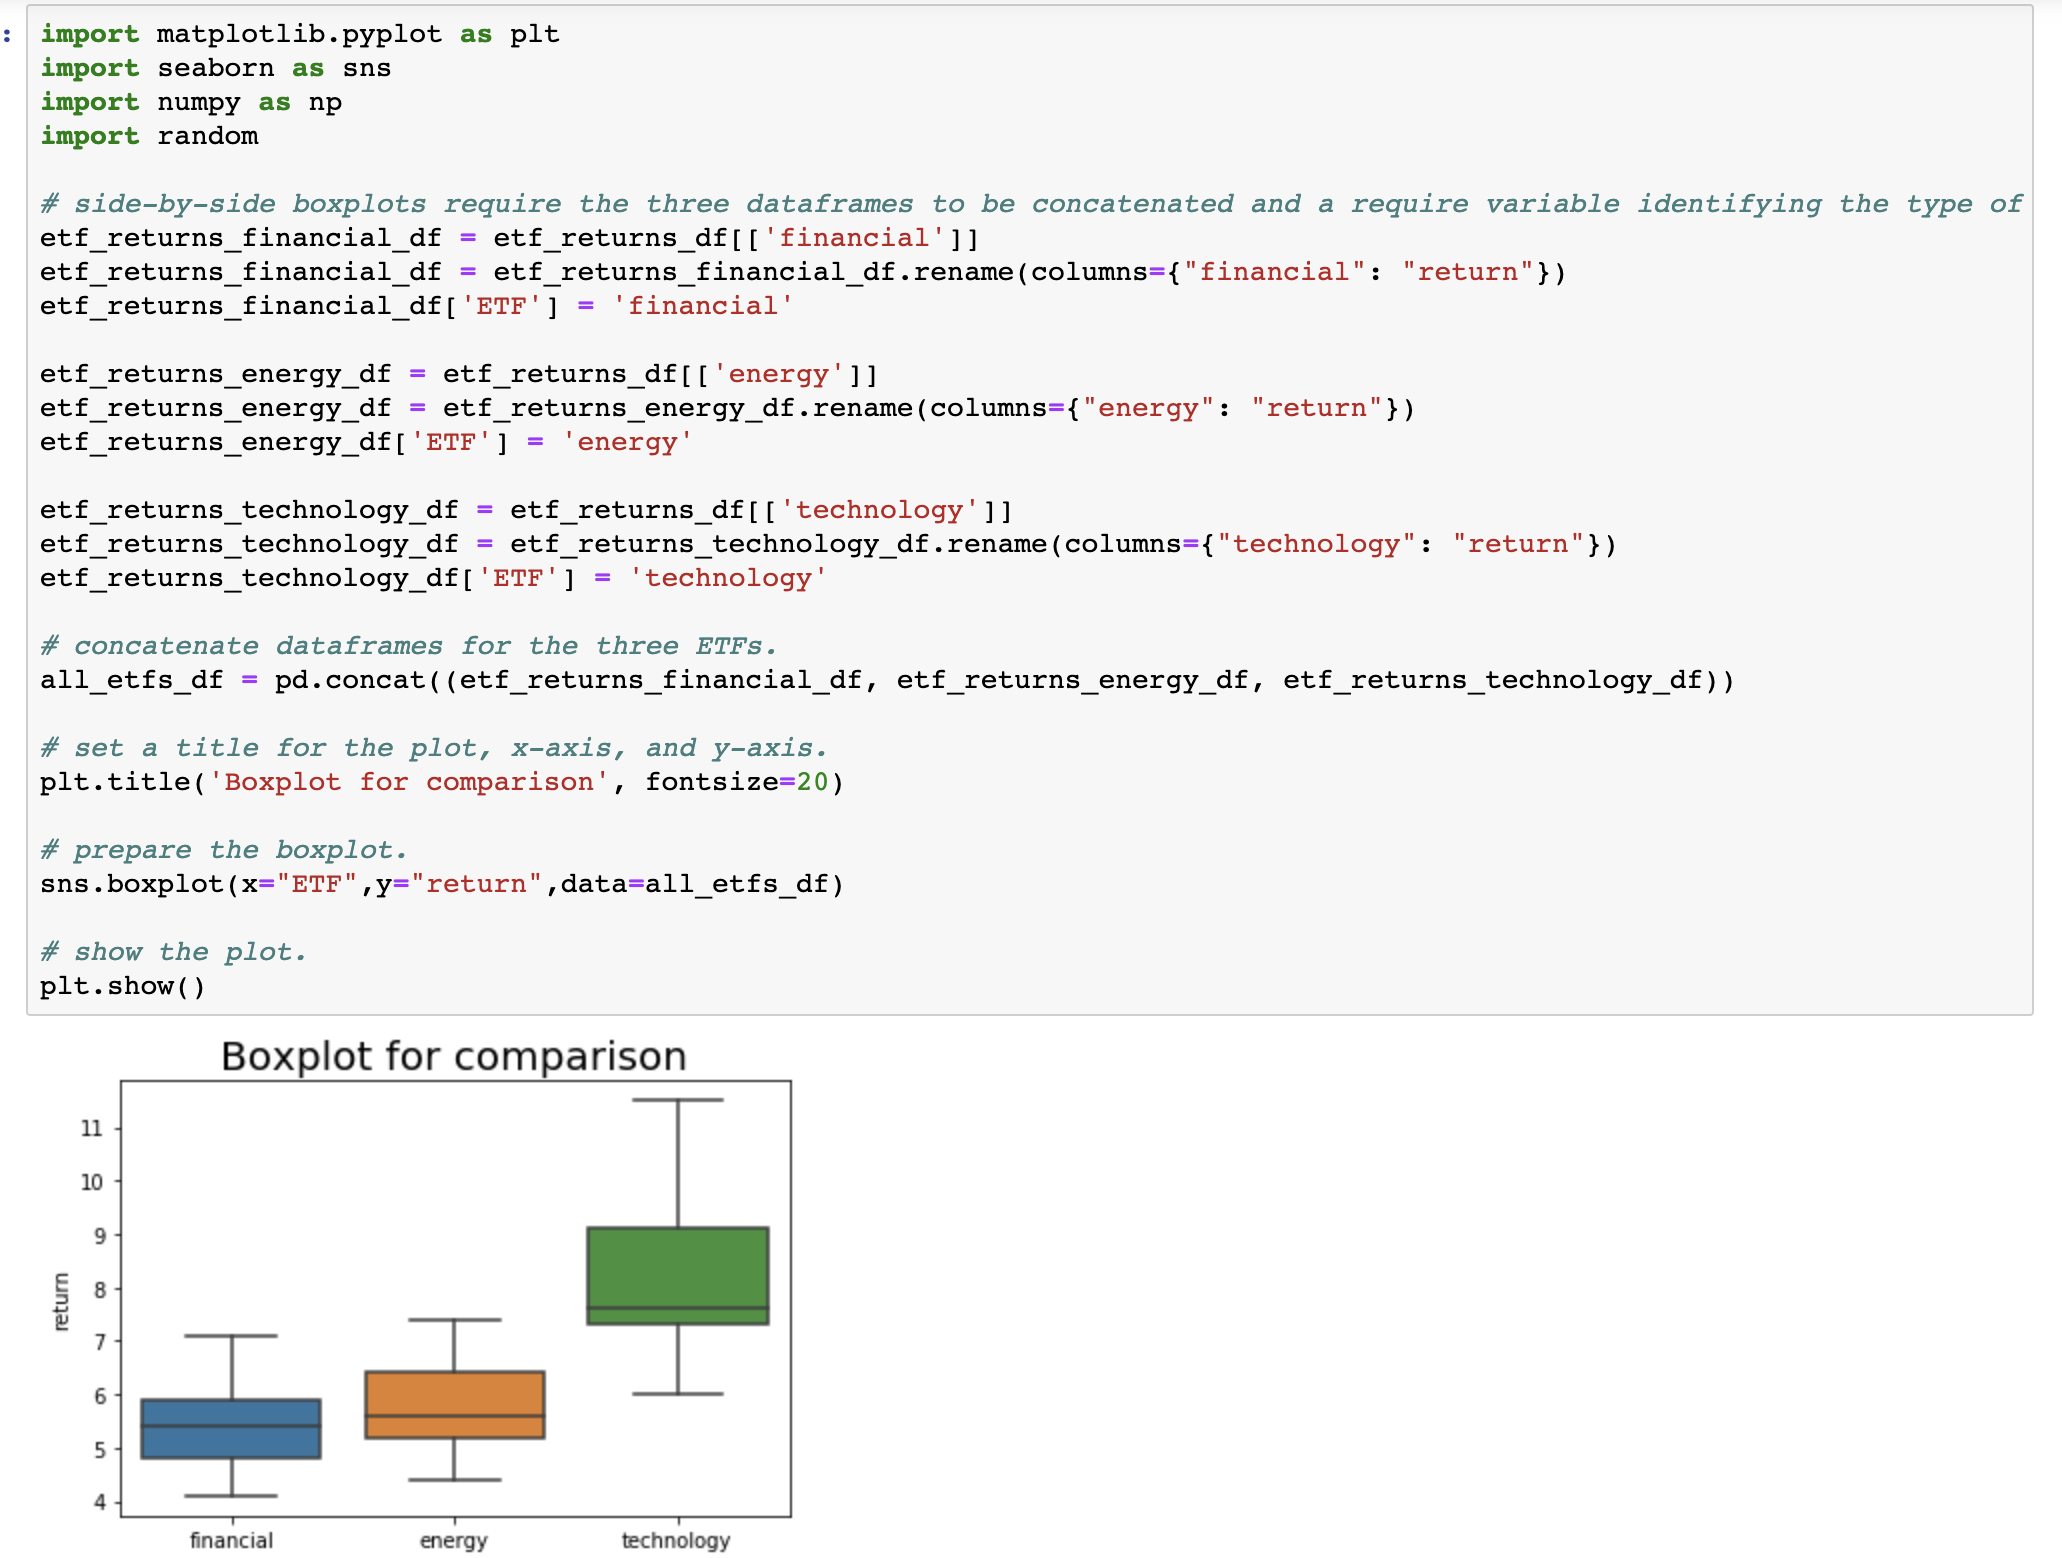
- Does a side-by-side boxplot of the 10-year returns of ETFs from the three sectors confirm your conclusion of the hypothesis test? Why or why not? See Step 3 in the Python script.
Step 1: Uploading the dataset
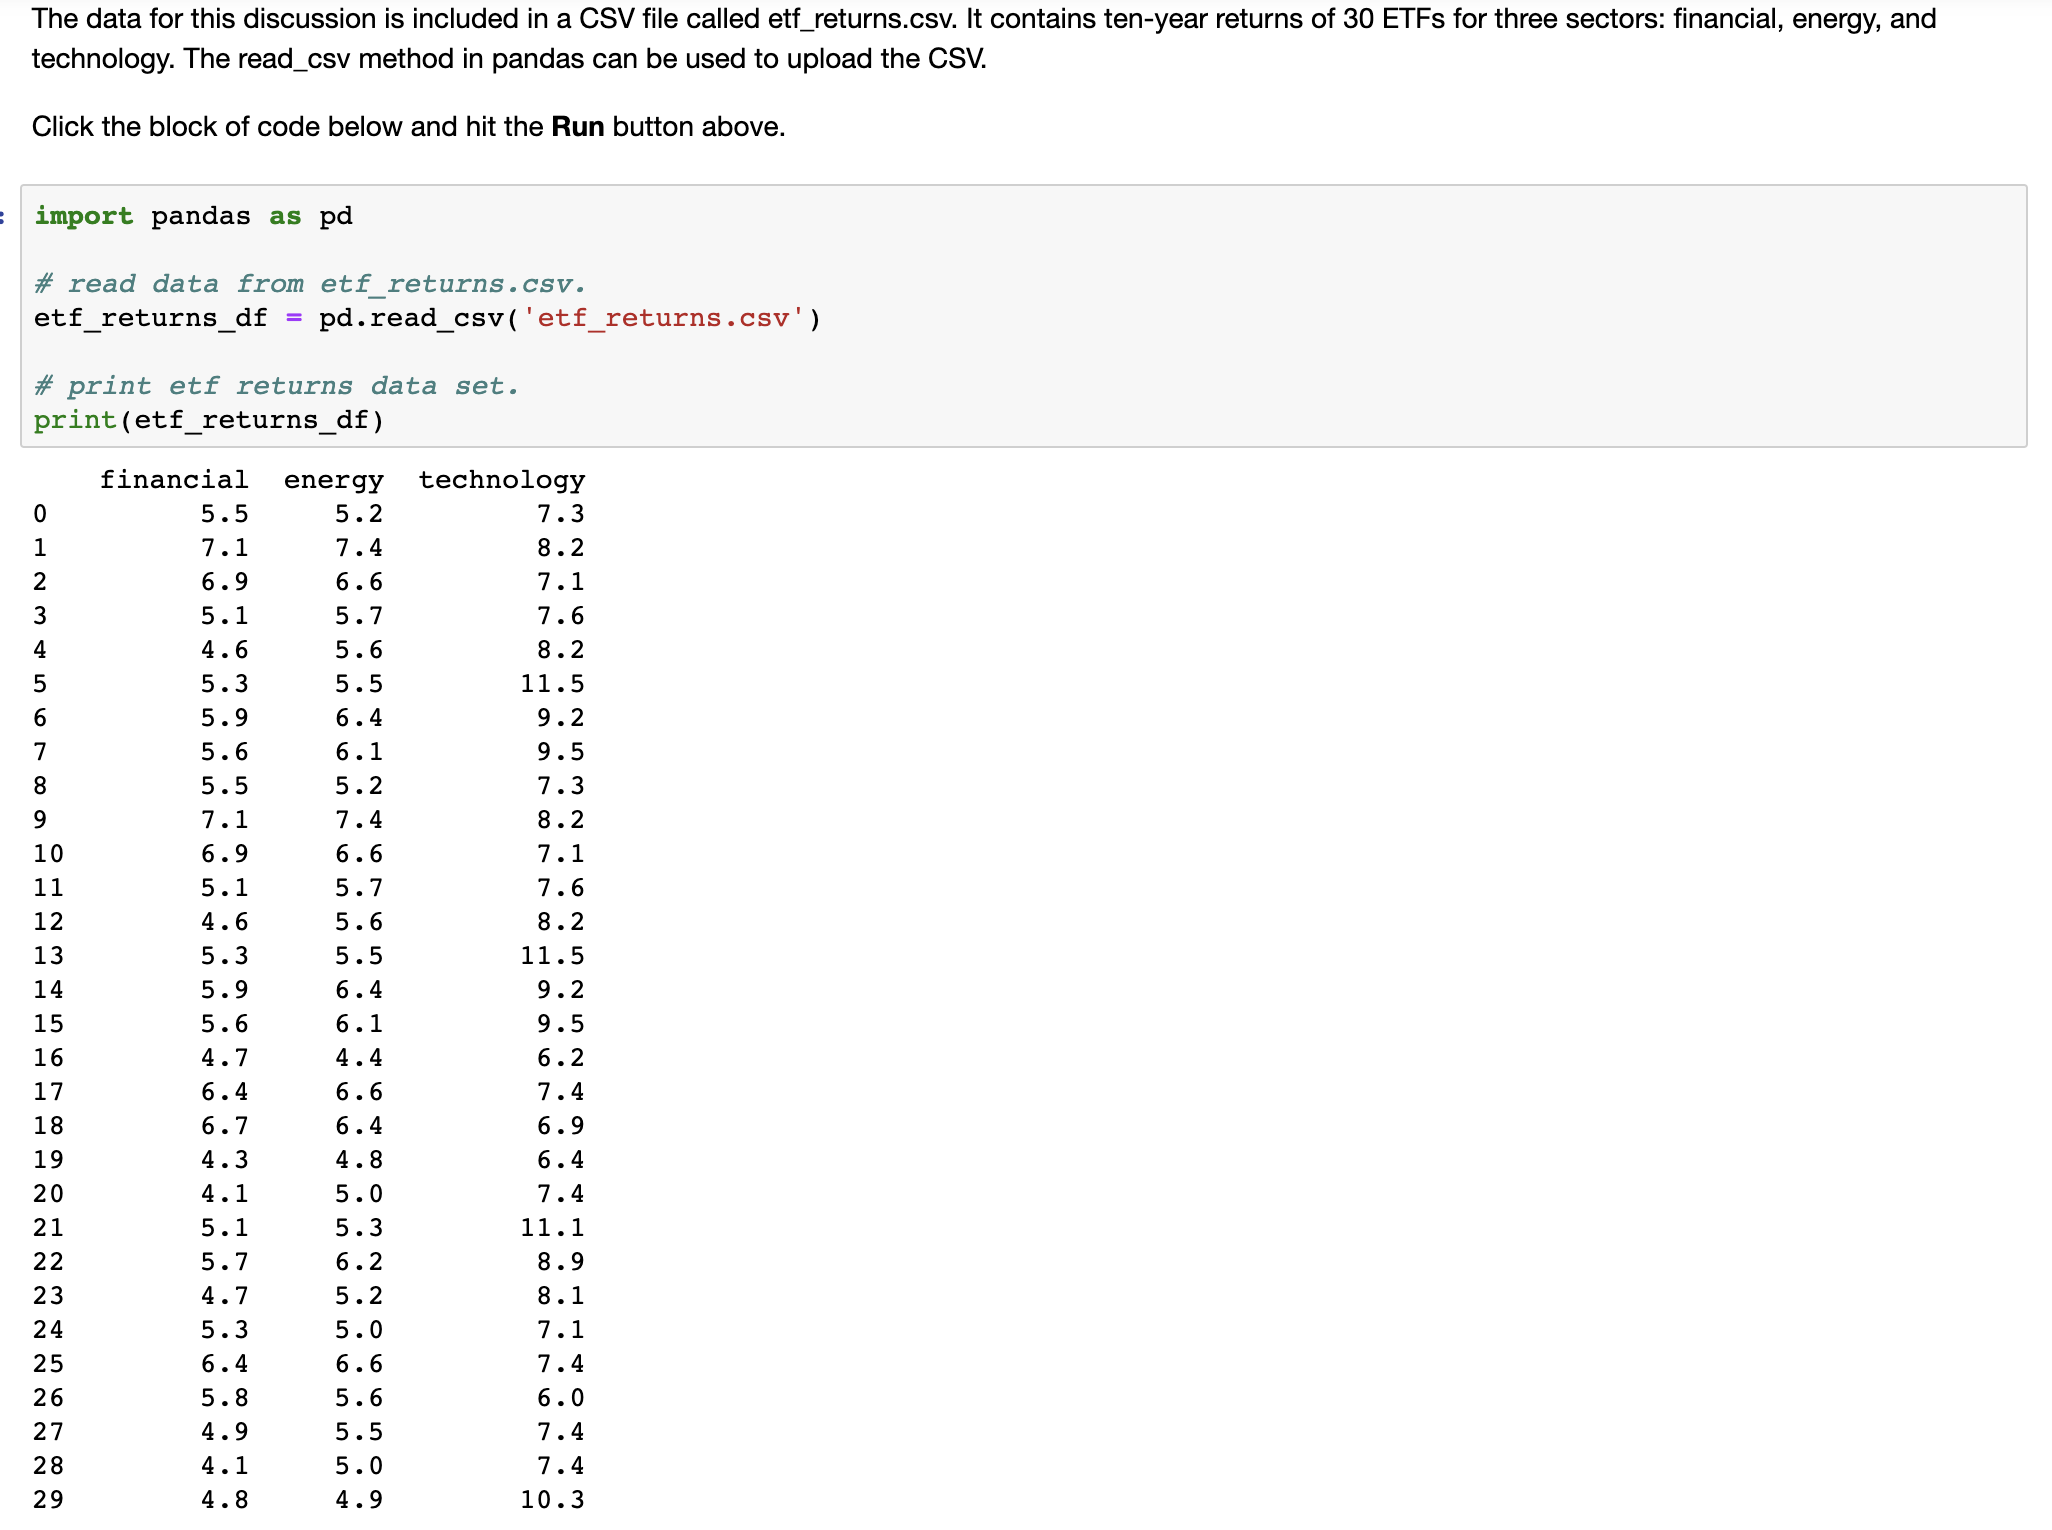
The data for this discussion is included in a CSV file called etf_returns.csv. It contains ten-year returns of 30 ETFs for three sectors: financial, energy, and technology. The read_csv method in pandas can be used to upload the CSV.
import pandas as pd
?
# read data from etf_returns.csv.
etf_returns_df = pd.read_csv('etf_returns.csv')
?
# print etf returns data set.
print(etf_returns_df)
financialenergytechnology
05.55.27.3
17.17.48.2
26.96.67.1
35.15.77.6
44.65.68.2
55.35.511.5
65.96.49.2
75.66.19.5
85.55.27.3
97.17.48.2
106.96.67.1
115.15.77.6
124.65.68.2
135.35.511.5
145.96.49.2
155.66.19.5
164.74.46.2
176.46.67.4
186.76.46.9
194.34.86.4
204.15.07.4
215.15.311.1
225.76.28.9
234.75.28.1
245.35.07.1
256.46.67.4
265.85.66.0
274.95.57.4
284.15.07.4
294.84.910.3
The data for this discussion is included in a CSV file called etf_returns.csv. It contains ten-year returns of 30 ETFs for three sectors: financial, energy, and technology. The read_csv method in pandas can be used to upload the CSV. Click the block of code below and hit the Run button above. import pandas as pd # read data from etf_returns. csv. etf_returns_df = pd. read_csv( 'etf_returns . csv' ) # print etf returns data set. print (etf_returns_df) financial energy technology 5.5 5. 2 7.3 7.1 7.4 8. 2 6.9 6.6 7.1 5 .1 5 . 7 7.6 4.6 5 . 6 8. 2 5 .3 5 .5 11.5 5.9 6.4 9 . 2 5 . 6 6 . 1 9 .5 5 .5 5 .2 7.3 7.1 7.4 8. 2 10 6.9 6 .6 7.1 11 5 . 1 5 . 7 7.6 12 4.6 5 . 6 8 . 2 13 5 .3 5 .5 11 . 5 14 5 .9 6. 4 9 . 2 15 5 . 6 6. 1 9 .5 16 4. 7 4. 4 6.2 17 6.4 6 .6 7.4 18 6.7 6. 4 6.9 19 4.3 4.8 5.4 20 4.1 5 .0 7.4 21 5 . 1 5 .3 11 . 1 22 5 . 7 6.2 8.9 23 4.7 5 . 2 8 . 1 24 5.3 5.0 7.1 25 6.4 6 . 6 7.4 26 5 . 8 5 . 6 6.0 27 4.9 5 .5 7.4 28 4.1 5 .0 7 .4 29 4. 8 4.9 10.3Step 2: Performing one-way ANOVA The scipy.stats submodule can be used to perform one-way analysis of variance (ANOVA). The method f_oneway is used to perform this test. The inputs are individual dataframes of all groups (in this discussion, groups are sectors). Click the block of code below and hit the Run button above. import scipy . stats as st # save return data for individual sectors for input to f_oneway method. etf_returns_financial = etf_returns_df[ ' financial' ] etf_returns_energy = etf_returns_df[ 'energy' ] etf_returns_technology = etf_returns_df[ 'technology' ] # print the outputs: the test statistic and the P-value. test_statistic, p_value = st. f_oneway (etf_returns_financial, etf_returns_energy, etf_returns_technology) print ("test statistic =", round(test_statistic, 2) ) print ( "P-value =", round(p_value, 4) ) test statistic = 55. 07 P-value = 0.0import matplotlib. pyplot as plt import seaborn as sns import numpy as np import random # side-by-side boxplots require the three dataframes to be concatenated and a require variable identifying the type of etf_returns_financial_df = etf_returns_df [ [' financial' ] ] etf_returns_financial_df = etf_returns_financial_df . rename (columns={ "financial": "return"} ) etf_returns_financial_df [ 'ETF' ] = 'financial' etf_returns_energy_df = etf_returns_df[ [ energy' ] ] etf_returns_energy_df = etf_returns_energy_df . rename (columns={"energy": "return"} ) etf_returns_energy_df [ 'ETF' ] = 'energy etf_returns_technology_df = etf_returns_df [ [ 'technology' ] ] etf_returns_technology_df = etf_returns_technology_df . rename (columns={ "technology": "return"}) etf_returns_technology_df [ 'ETF' ] = 'technology # concatenate dataframes for the three ETFS. all_etfs_df = pd. concat ( (etf_returns_financial_df, etf_returns_energy_df, etf_returns_technology_df) ) # set a title for the plot, x-axis, and y-axis. pit . title( 'Boxplot for comparison', fontsize=20) # prepare the boxplot. sns . boxplot (x="ETF" , y="return" , data=all_etfs_df) # show the plot. pit . show( ) Boxplot for comparison 11 10 9 Co return financial energy technology
Step by Step Solution
There are 3 Steps involved in it

Get step-by-step solutions from verified subject matter experts