Question: I am looking for the answer to 2e- I just need to figure out how to do future cash flows. It is fine to assume
I am looking for the answer to 2e- I just need to figure out how to do future cash flows. It is fine to assume a tax rate, NWC, depreciation, etc.
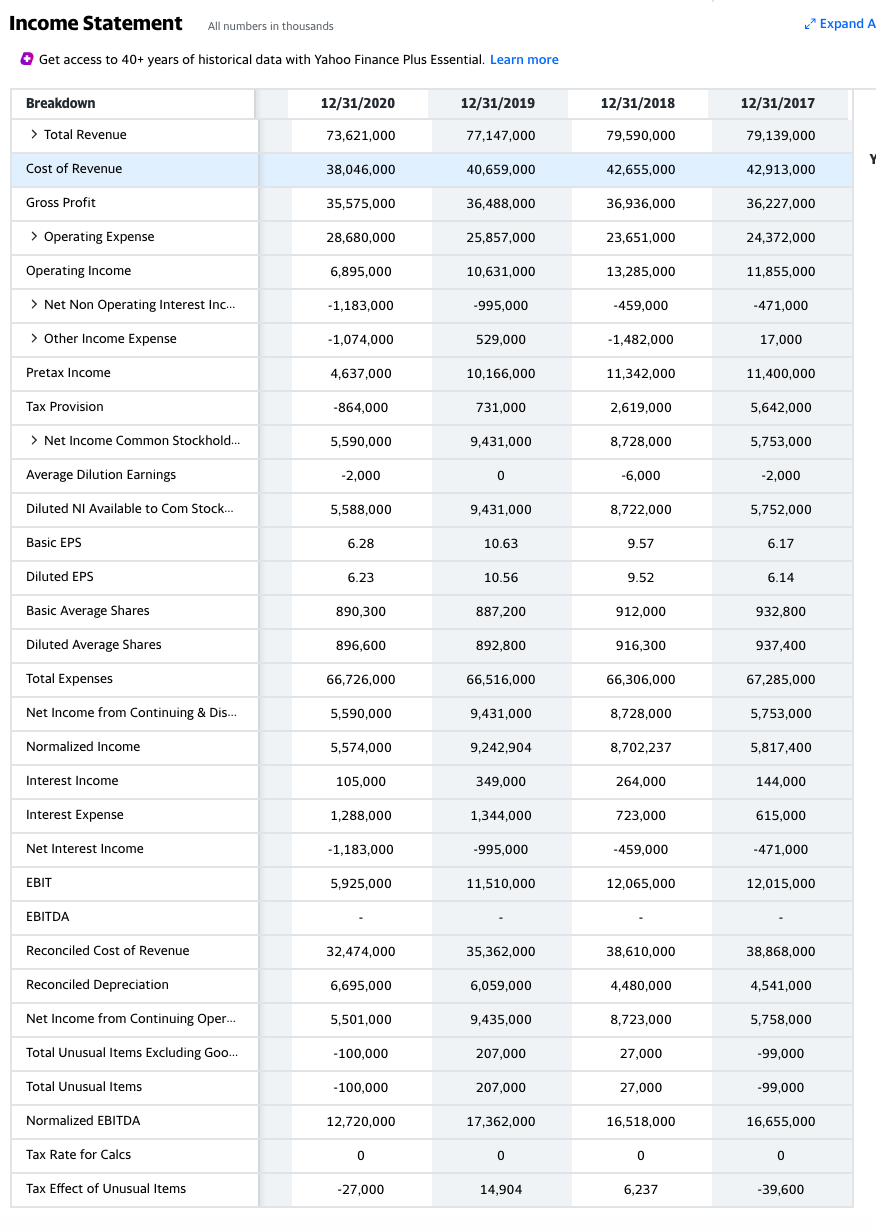
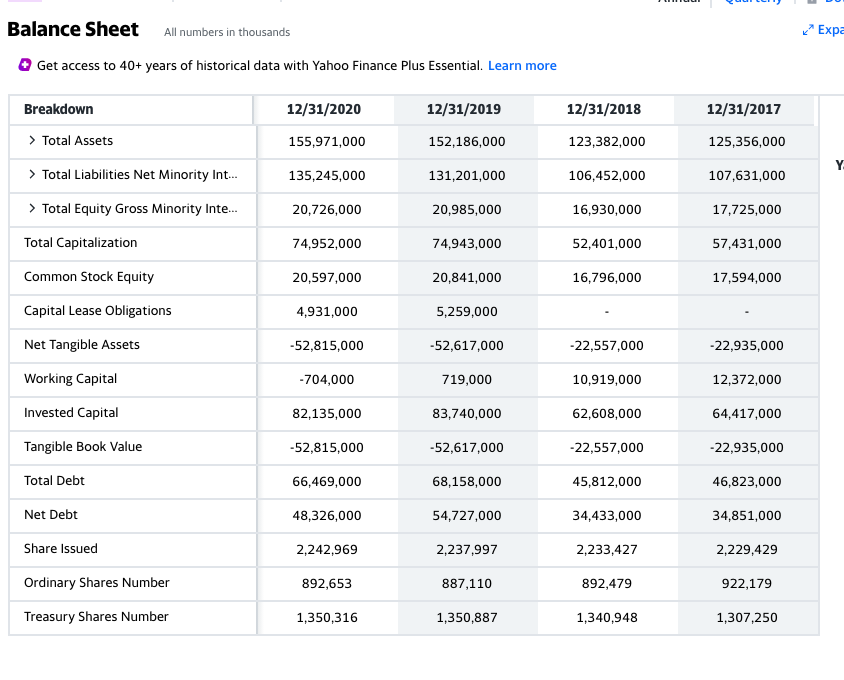
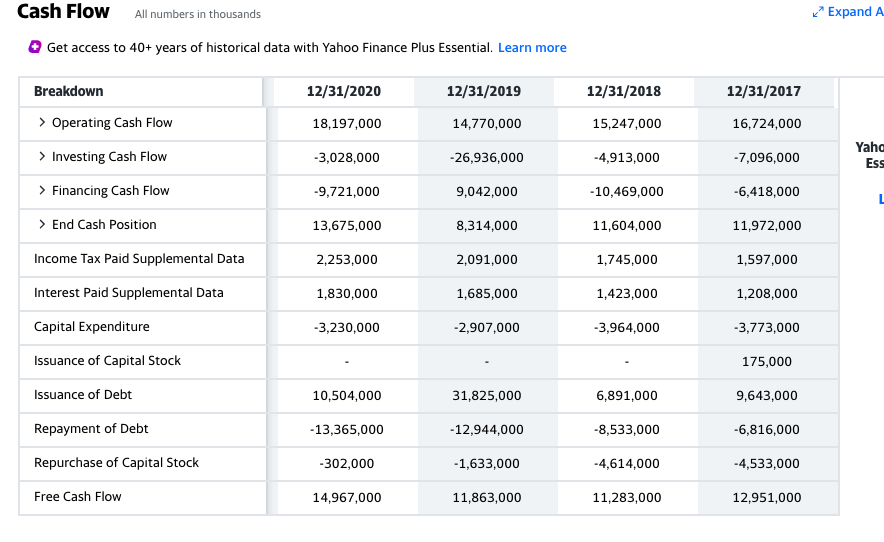
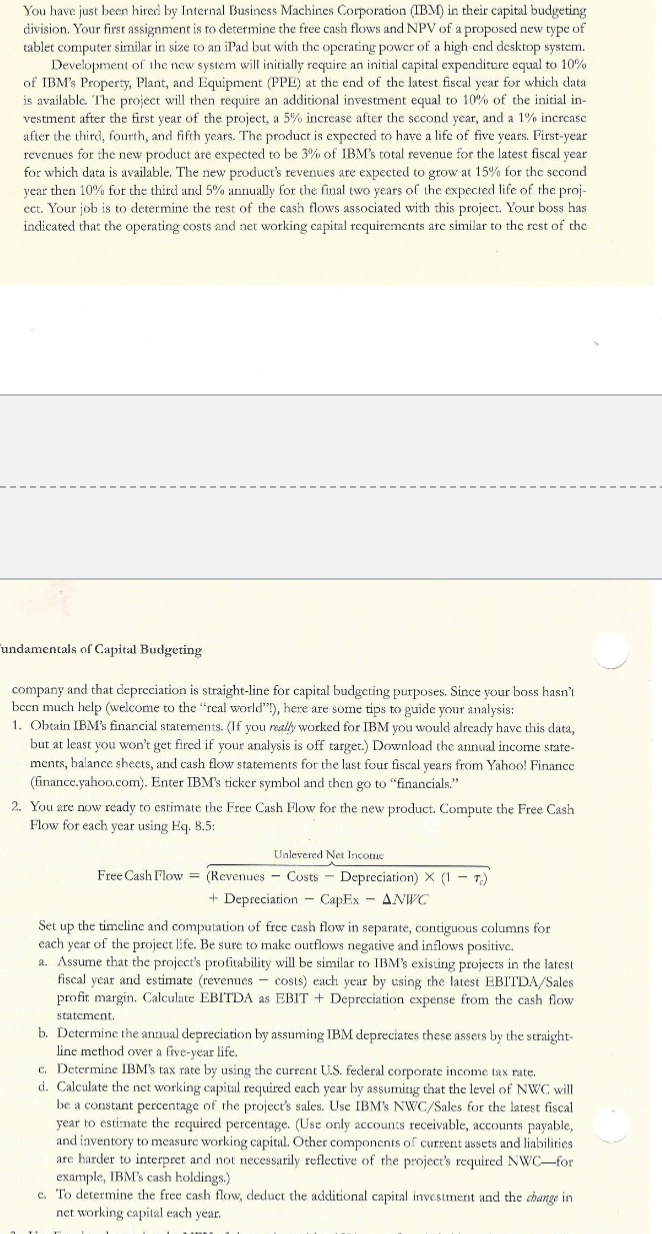
Income Statement All numbers in thousands 0 Get access to 40+ years of historical data with Yahoo Finance Plus Essential. Learn more Breakdown > Total Revenue Cost of Revenue Gross Prot > Operating Expense Operating Income > Net Non Operating Interest Inc... > Other Income Expense Prelax Income Tax Provision > Net Income Common Stockhold... Average Dilution Earnings Diluted NI Available to Com Stock... Basic EFS Diluted EFS Basic Average Shares Diluted Average Shares Total Expenses Net Income from Continuing 81 Dis... Normalized Income Interest Income Interest Expense Net Interest Income EBIT EBITDA Reconciled Cost of Revenue Reconciled Depreciation Net Income from Continuing Oper... Total Unusual Items Excluding Goo... Total Unusual Items Normalized EBITDA Tax Rate for Calcs Tax Effect of Unusual Items 1223122020 23,521,000 33,045,000 35,525,000 23,530,000 6,395,00 0 -1,133,000 -1,024,000 4,532,000 -354,000 5,530,00 0 -2,000 5,533,000 5.23 5.23 330,300 335,500 55,225,000 5,530,000 5,524,000 105,000 1,233,000 -1,133,000 5,925,00 0 32,42 4,000 5,535,000 5,501,000 -100,000 -100,000 12,220,000 0 -27,000 12231p013 22,142,000 40,553,000 35,433,000 25,352,000 10,531,000 335,000 523,000 10,155,000 231,000 3,431 ,000 0 3,431 ,000 10.53 10.55 332,200 332,300 55,515,000 3,431,000 3,242 ,3 04 343,000 1,344,000 -335,000 11,510,000 35,352,000 5,053,000 3,435,000 202,000 202,000 12,352,000 0 14,904 1223122013 23,530,000 42,555,000 35,335,000 23,551,000 13,235,000 -453,000 -1,432,000 11,342,000 2,513,000 3,223,000 -5, 000 3,222,000 3.52 3.52 312,000 315,300 55,305,000 3,223,000 3,202,232 254,000 223,000 -453,000 12,065,000 33,510,000 4,430,000 3,223,000 22,000 22,000 15,513,000 0 6,237 2" Expand A 1223112012 23,133,000 42,313,000 35,22 2,000 24,322,000 11,35 5,000 -421,000 12,000 11,40 0,000 5,542,000 5,253,000 -2,000 5,252,000 5.12 5.14 332,300 332,400 52,23 5,000 5,253,000 5,312,400 144,000 515,000 -421,000 1 2,01 5, [I [IO 33,353,000 4,541,000 5,253,000 -33,000 -33,000 15,55 5,000 0 69,600 Balance Sheet All numbers in thousands Exp + Get access to 40+ years of historical data with Yahoo Finance Plus Essential. Learn more Breakdown 12/31/2020 12/31/2019 12/31/2018 12/31/2017 > Total Assets 155,971,000 152,186,000 123,382,000 125,356,000 > Total Liabilities Net Minority Int... 135,245,000 131,201,000 106,452,000 107,631,000 > Total Equity Gross Minority Inte... 20,726,000 20,985,000 16,930,000 17,725,000 Total Capitalization 74,952,000 74,943,000 52,401,000 57,431,000 Common Stock Equity 20,597,000 20,841,000 16,796,000 17,594,000 Capital Lease Obligations 4,931,000 5,259,000 Net Tangible Assets -52,815,000 -52,617,000 -22,557,000 -22,935,000 Working Capital -704,000 719,000 10,919,000 12,372,000 Invested Capital 82,135,000 83,740,000 62,608,000 64,417,000 Tangible Book Value -52,815,000 -52,617,000 -22,557,000 -22,935,000 Total Debt 66,469,000 68,158,000 45,812,000 46,823,000 Net Debt 48,326,000 54,727,000 34,433,000 34,851,000 Share Issued 2,242,969 2,237,997 2,233,427 2,229,429 Ordinary Shares Number 892,653 887,110 892,479 922,179 Treasury Shares Number 1,350,316 1,350,887 1,340,948 1,307,250cash Flow All numbers in thousands z, Expand A 0 Get access to 40+ years of historical data with Yahoo Finance Plus Essential. Learn more Breakdown 1213112020 1213112019 1213112010 1213112011r > Operating Cash Flow 13,197,000 14,770,000 15,247,000 16,724,000 > Investing Cash Flow -3,023,000 -26,936,000 4,913,000 -7,096,000 fag > Financing Cash Flow -9,721,000 9,042,000 40,469,000 -6,413,000 I > End Cash Position 13,675,000 3,314,000 11,604,000 11,972,000 Income Tax Paid Supplemental Data 2,253,000 2,091,000 1,745,000 1,597,000 Interest Paid Eupplemental Data 1,330,000 1,635,000 1,423,000 1,203,000 Capital Expenditure -3,230,000 2,907,000 -3,964,000 -3,773,000 Issuance of Capital Stock - - - 175,000 Issuance of Debt 10,504,000 31,325,000 6,391,000 9,643,000 Repayment of Debt 43,365,000 42,944,000 43,533,000 -6,316,000 Repurchase of Capital Stock -302,000 -1,633,000 4,614,000 -4,533,000 Free Cash FltmI 14,967,000 11,363,000 11,283,000 12,951,000 You have just been hired by Internal Business Machines Corporation (IBM) in their capital budgeting division. Your first assignment is to determine the free cash flows and NPV of a proposed new type of tablet computer similar in size to an iPad but with the operating power of a high end desktop system. Development of the new system will initially require an initial capital expenditure equal to 10% of IBM's Property, Plant, and Equipment (PPE) at the end of the latest fiscal year for which data is available. The project will then require an additional investment equal to 10% of the initial in- vestment after the first year of the project, a 5% increase after the second year, and a 1% increase after the third, fourth, and fifth years. The product is expected to have a life of five years. First-year revenues for the new product are expected to be 3% of IBM's total revenue for the latest fiscal year for which data is available. The new product's revenues are expected to grow at 15% for the second year then 10% for the third and 5% annually for the final two years of the expected life of the proj- ect. Your job is to determine the rest of the cash flows associated with this project. Your boss has indicated that the operating costs and net working capital requirements are similar to the rest of the undamentals of Capital Budgeting company and that depreciation is straight-line for capital budgeting purposes. Since your boss hasn't been much help (welcome to the "real world"!), here are some tips to guide your analysis: 1. Obtain IBM's financial statements. (If you really worked for IBM you would already have this data, but at least you won't get fired if your analysis is off target.) Download the annual income state- ments, balance sheets, and cash flow statements for the last four fiscal years from Yahoo! Finance (finance.yahoo.com). Enter IBM's ticker symbol and then go to "financials." 2. You are now ready to estimate the Free Cash Flow for the new product. Compute the Free Cash Flow for each year using Eq. 8.5: Unlevered Net Income Free Cash Flow = (Revenues - Costs - Depreciation) X (1 - T.) + Depreciation - CapEx - ANWC Set up the timeline and computation of free cash flow in separate, contiguous columns for each year of the project life. Be sure to make outflows negative and inflows positive. a. Assume that the project's profitability will be similar to IBM's existing projects in the latest fiscal year and estimate (revenues - costs) each year by using the latest EBITDA/Sales profit margin. Calculate EBITDA as EBIT + Depreciation expense from the cash flow statement. b. Determine the annual depreciation by assuming IBM depreciates these assets by the straight- line method over a five-year life. c. Determine IBM's tax rate by using the current U.S. federal corporate income tax rate. d. Calculate the net working capital required each year by assuming that the level of NWC will be a constant percentage of the project's sales. Use IBM's NWC/Sales for the latest fiscal year to estimate the required percentage. (Use only accounts receivable, accounts payable, and inventory to measure working capital. Other components of current assets and liabilities are harder to interpret and not necessarily reflective of the project's required NWC-for example, IBM's cash holdings.) c. To determine the free cash flow, deduct the additional capital investment and the change in net working capital each year