Question: I am looking for the solution or guidance with the following case study. The case study has been asked about by other students but I
I am looking for the solution or guidance with the following case study. The case study has been asked about by other students but I cannot find the solution. can you direct me to it or provide some help.
Cheers Graeme
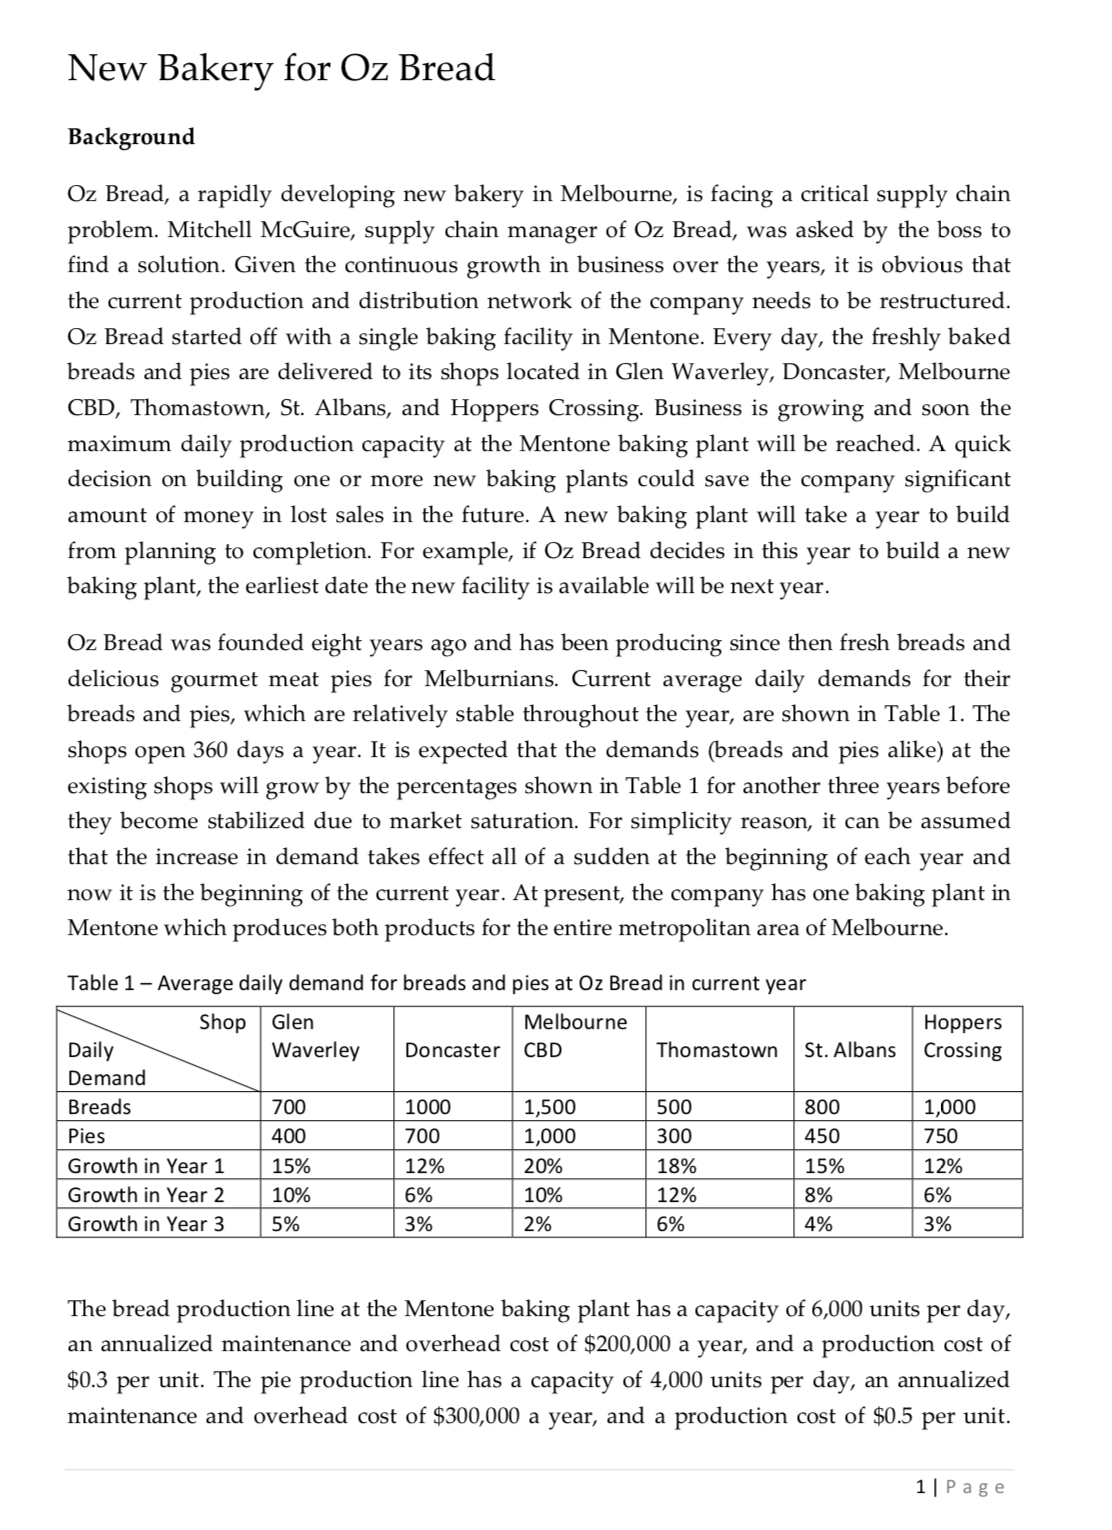
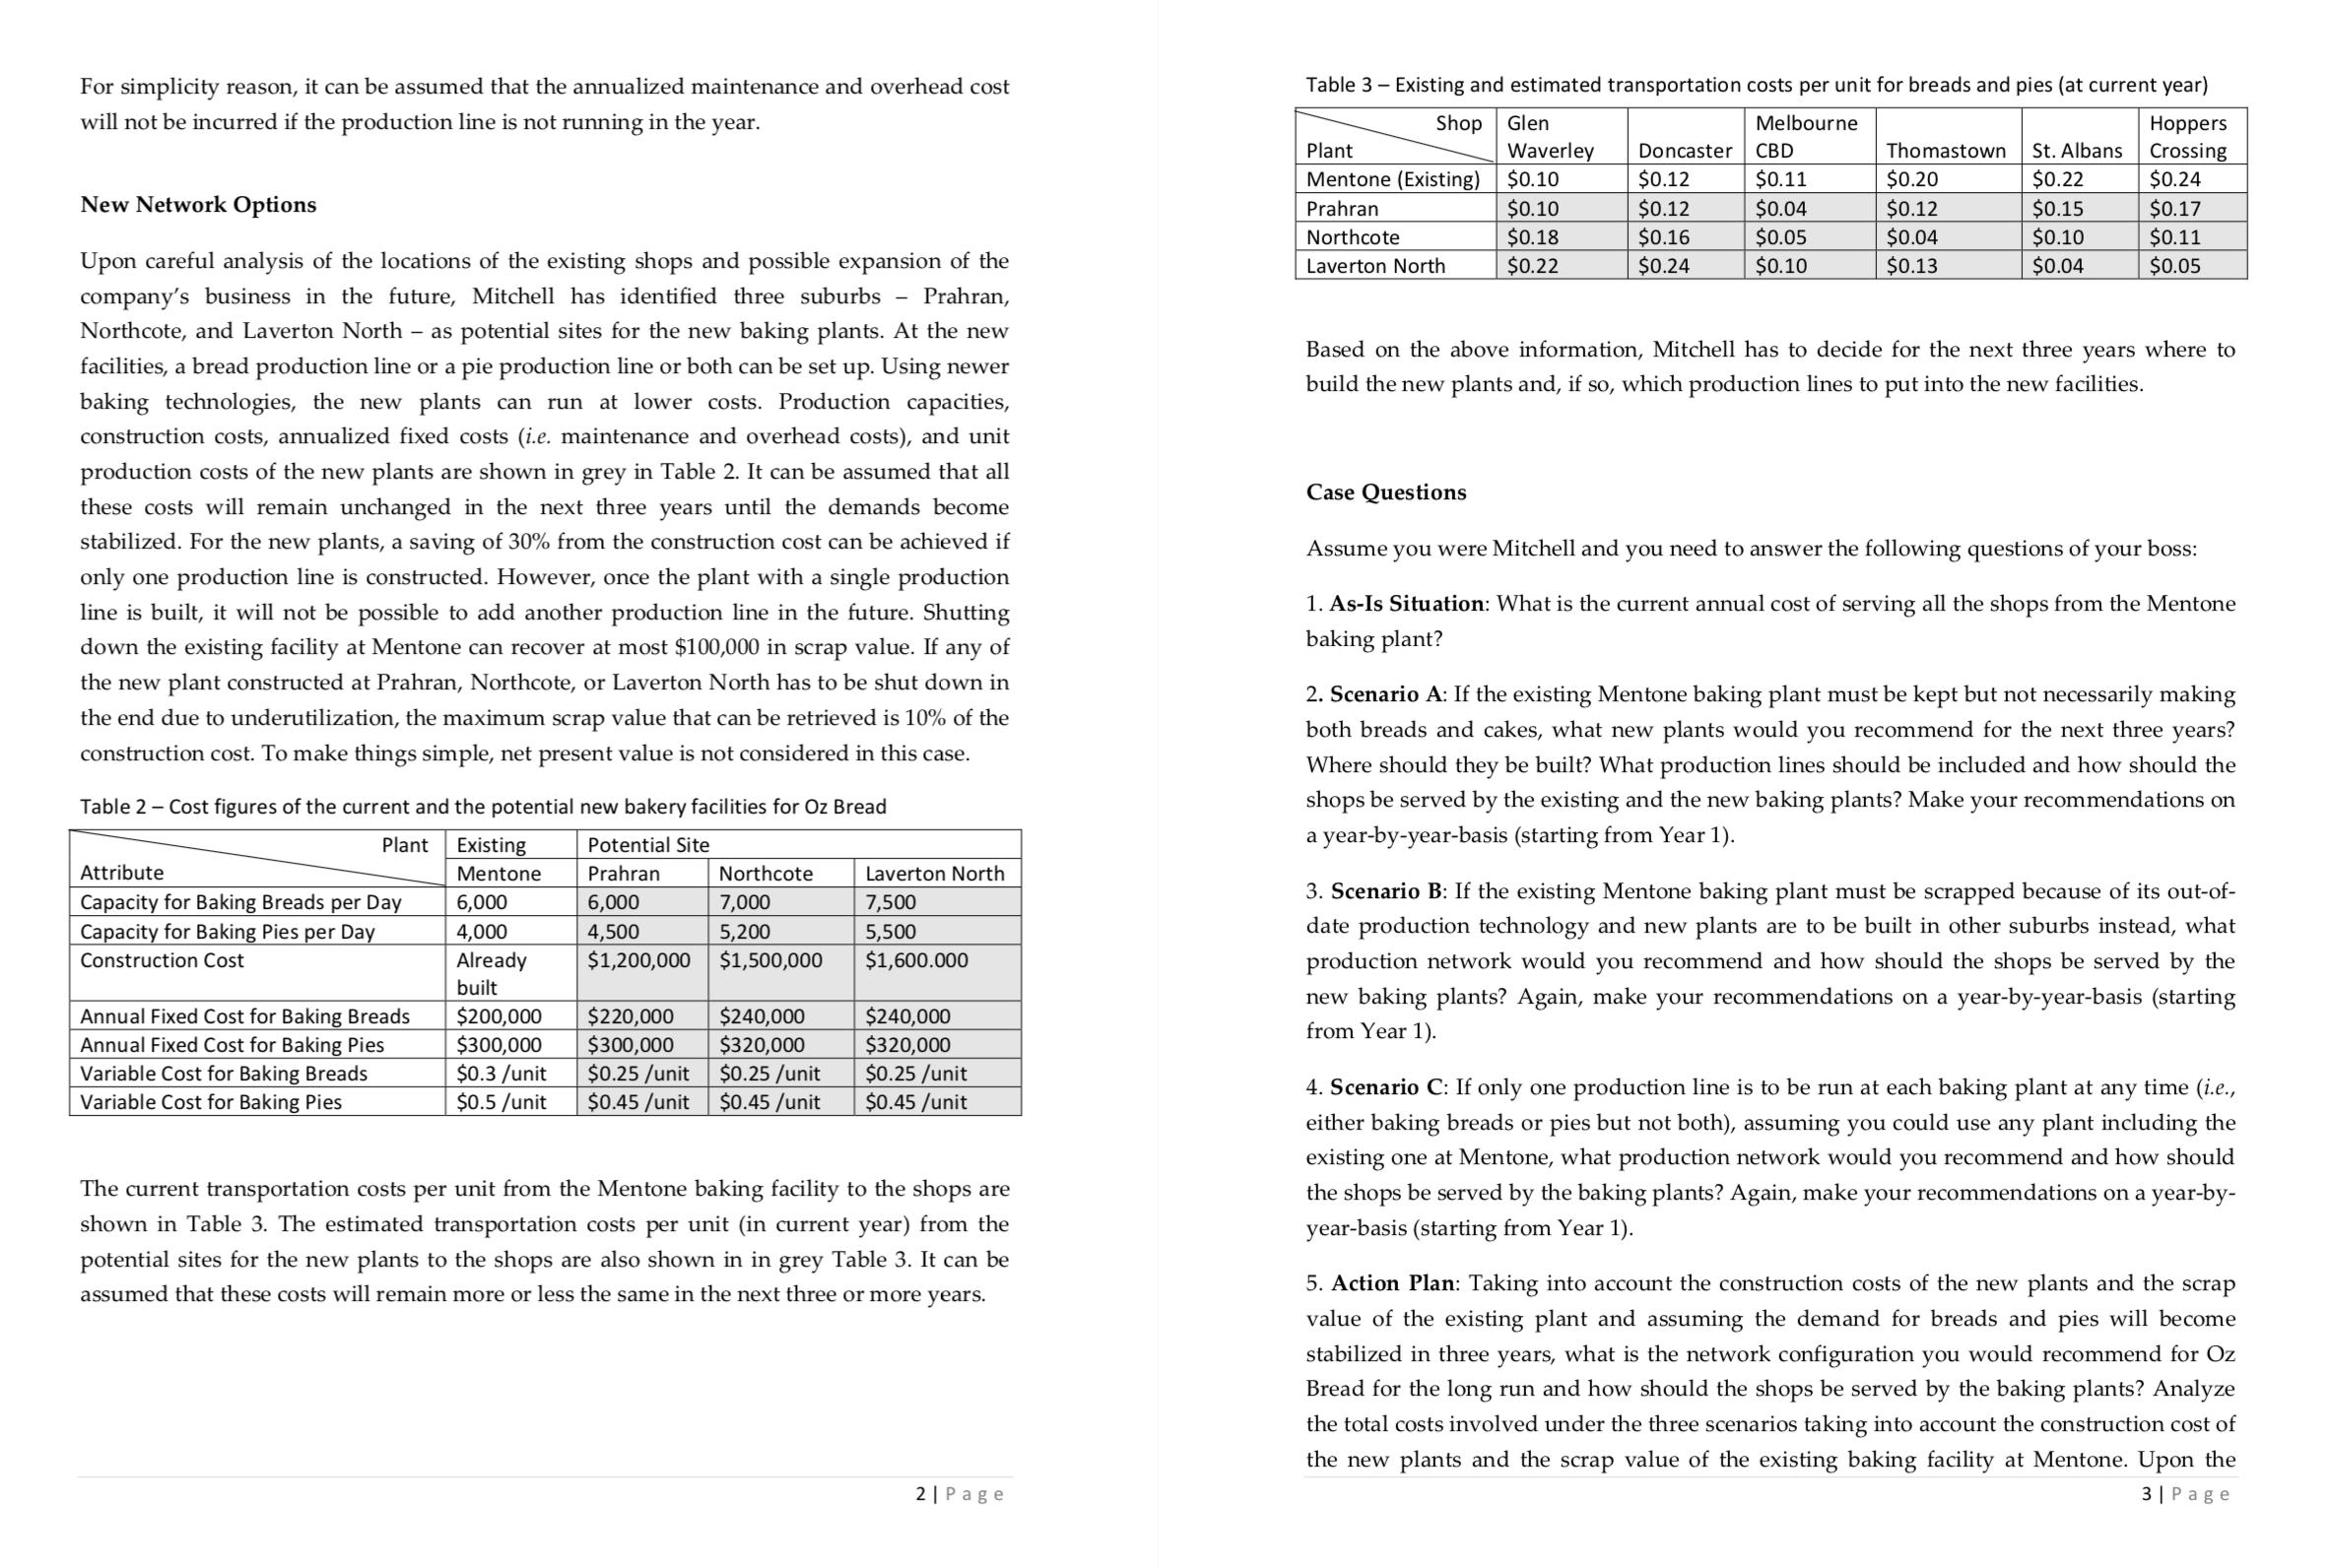
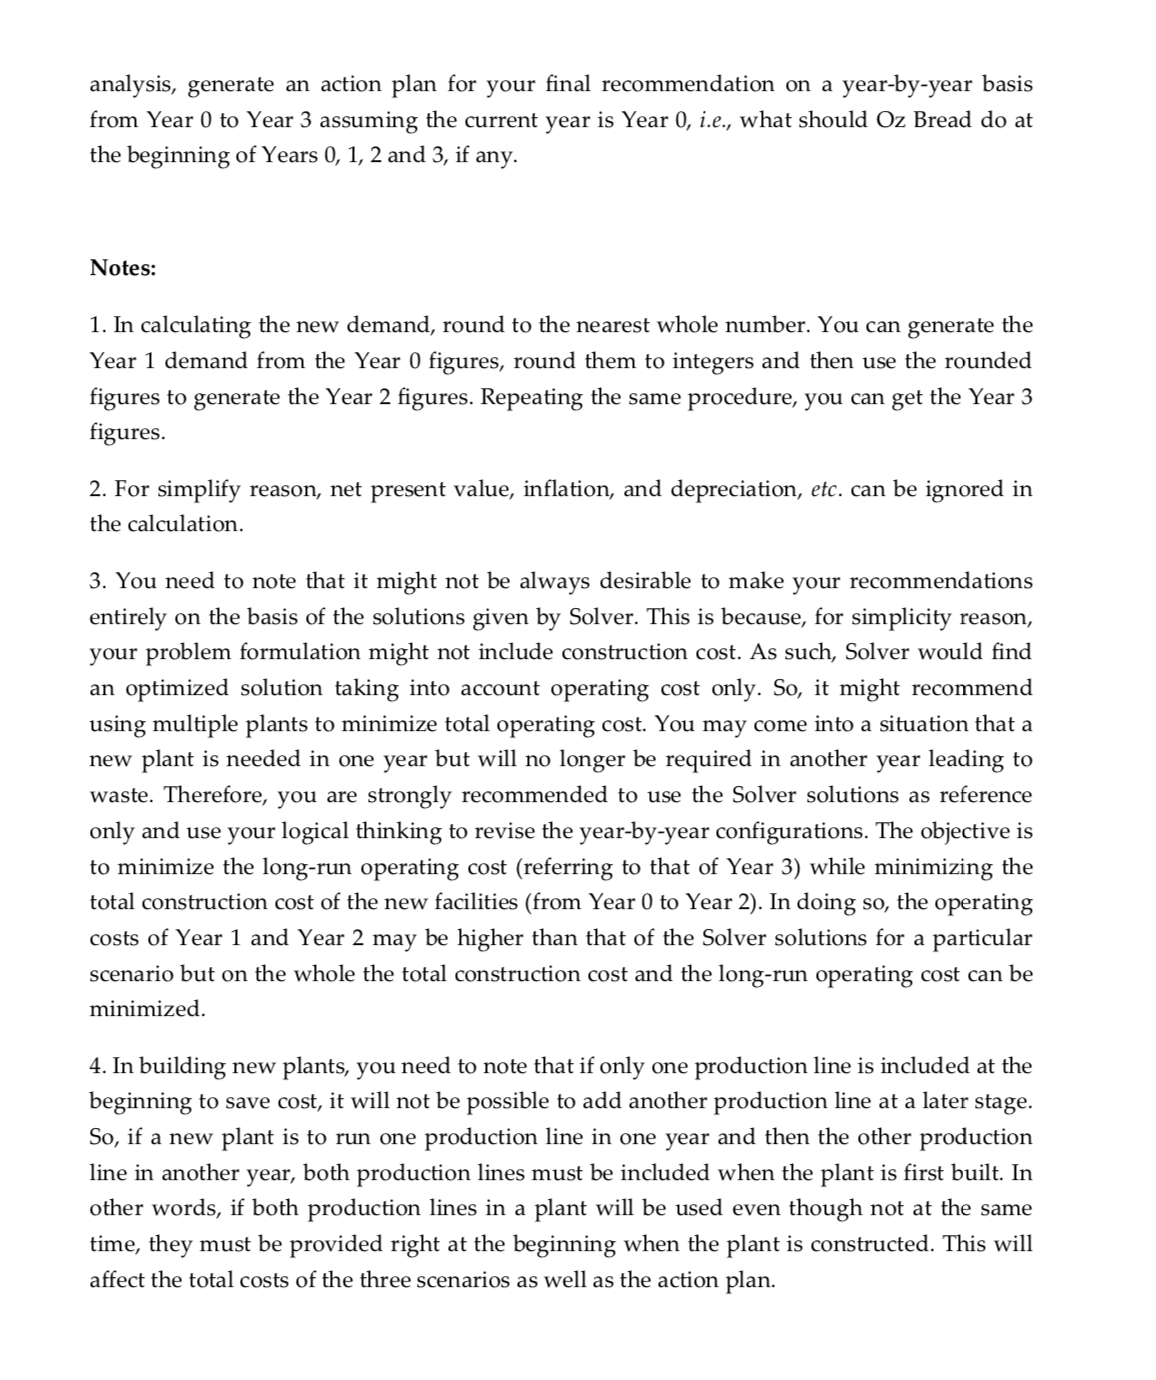
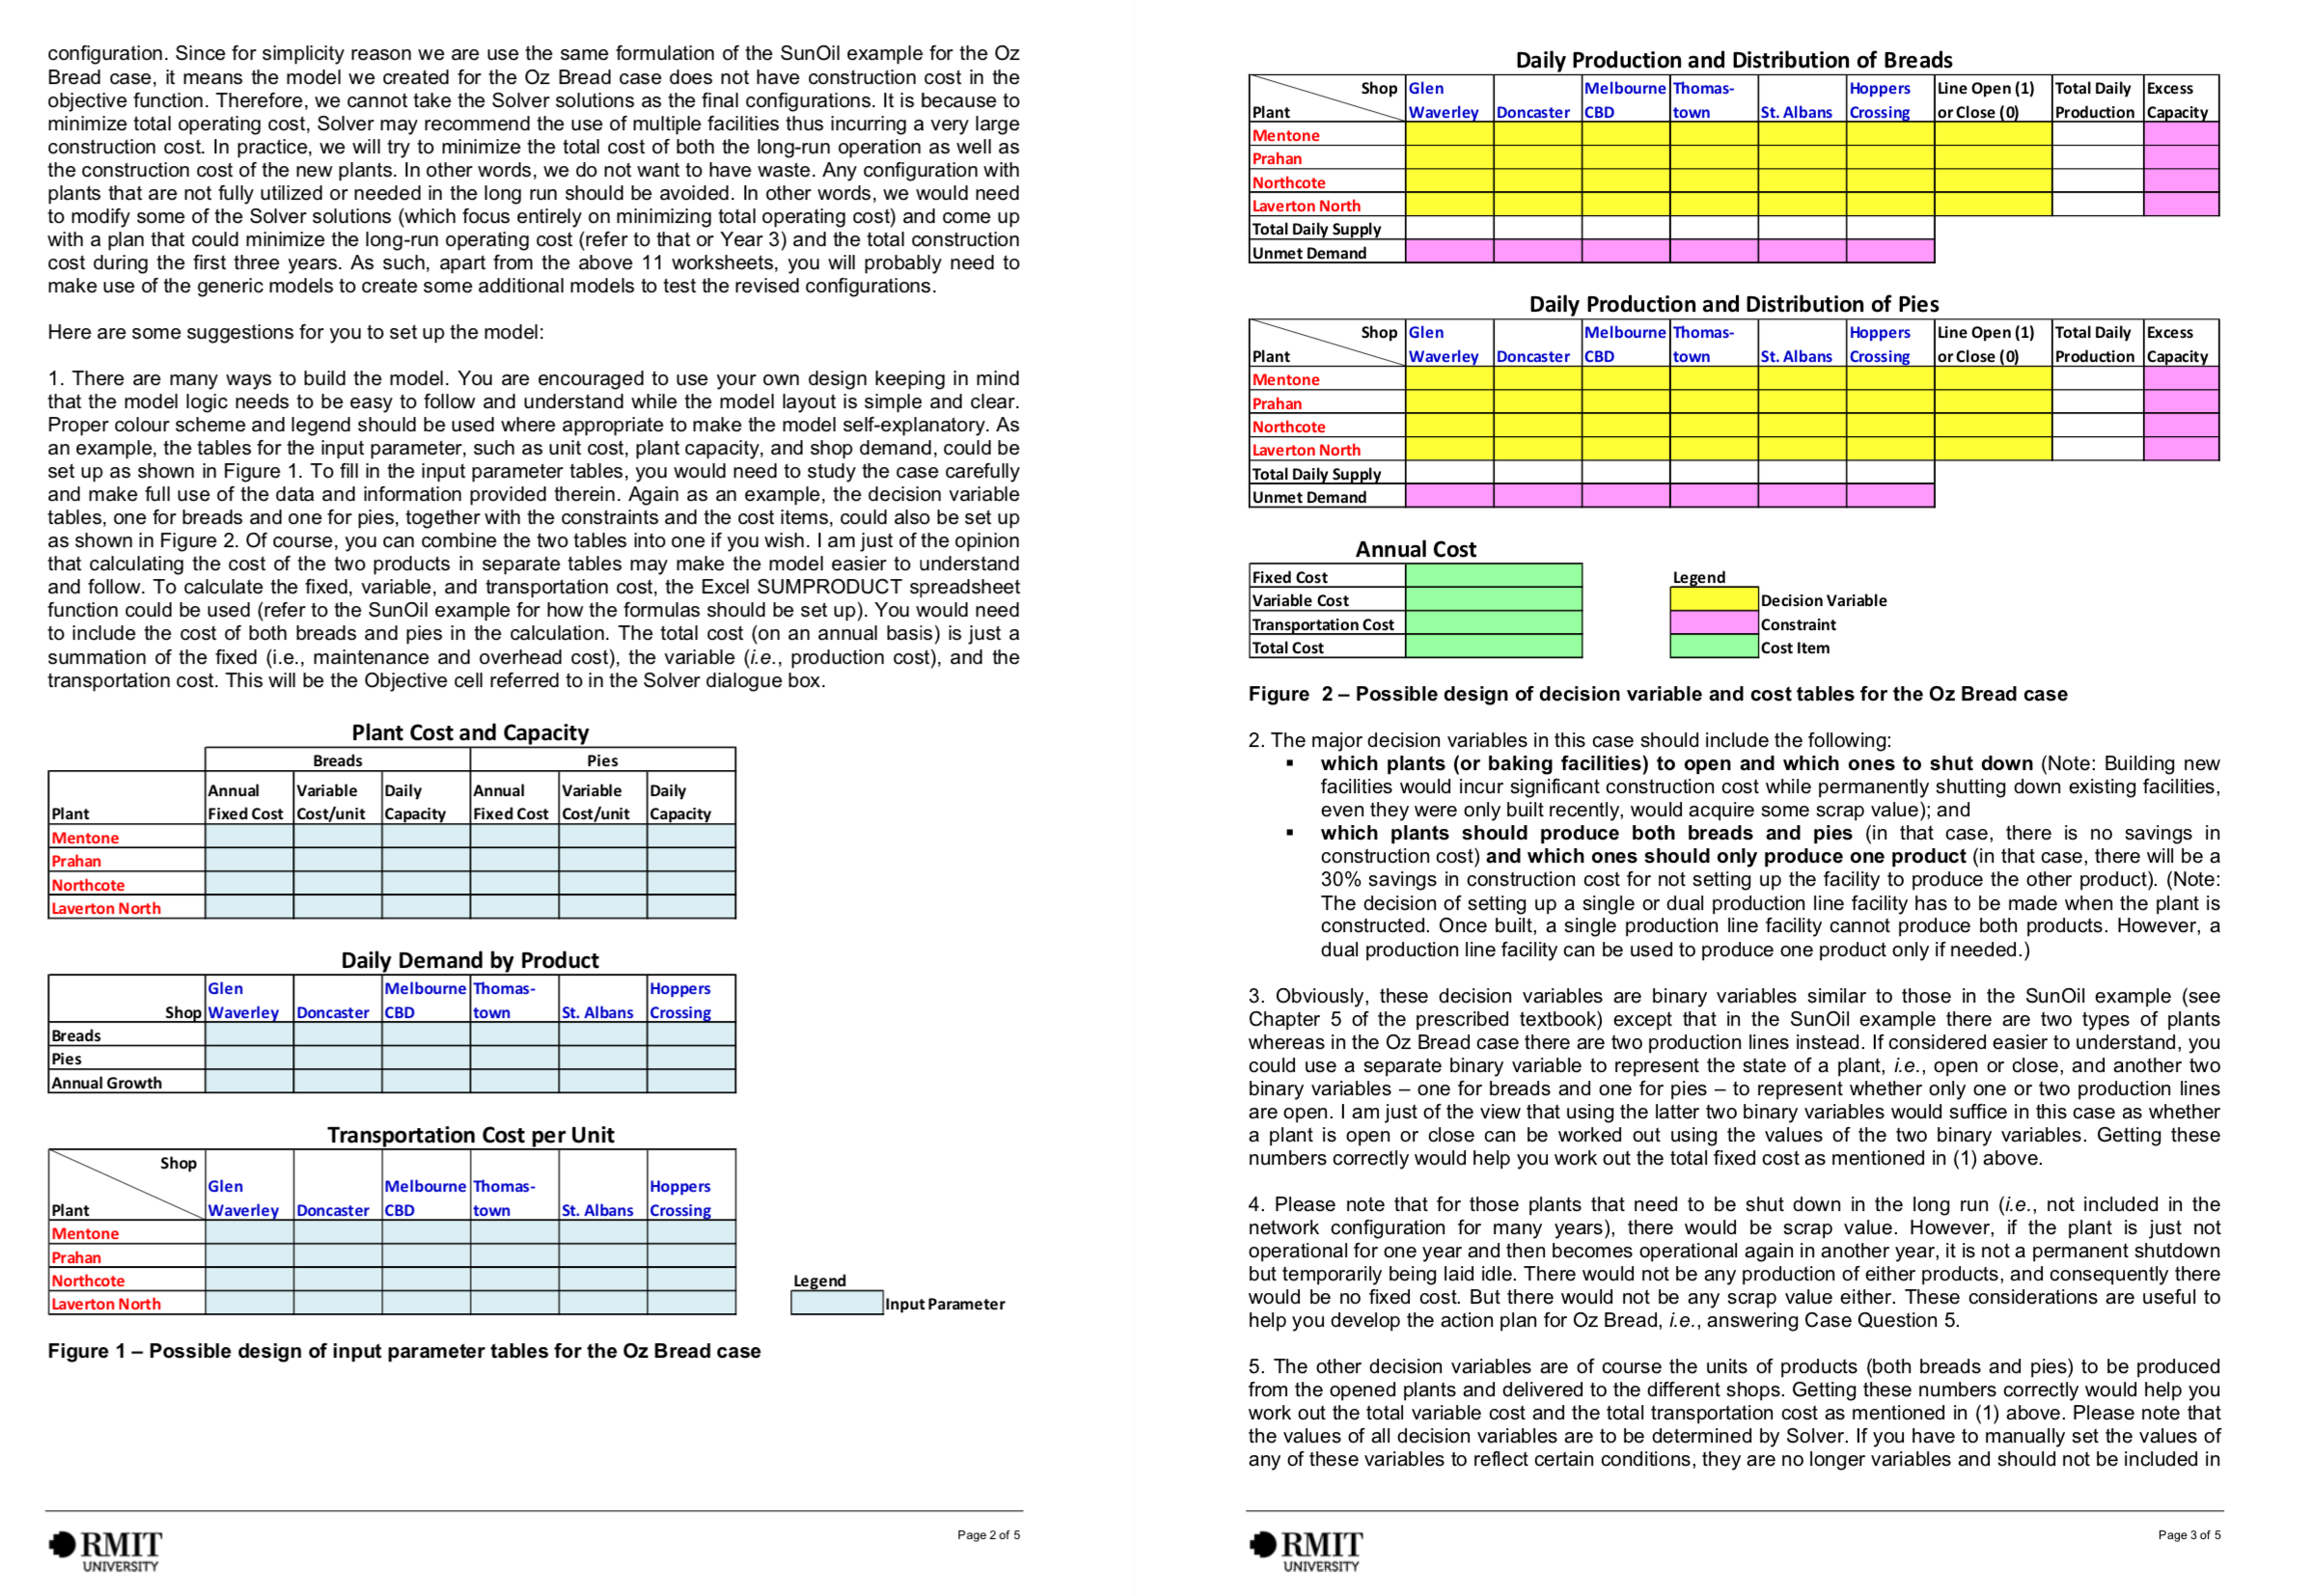
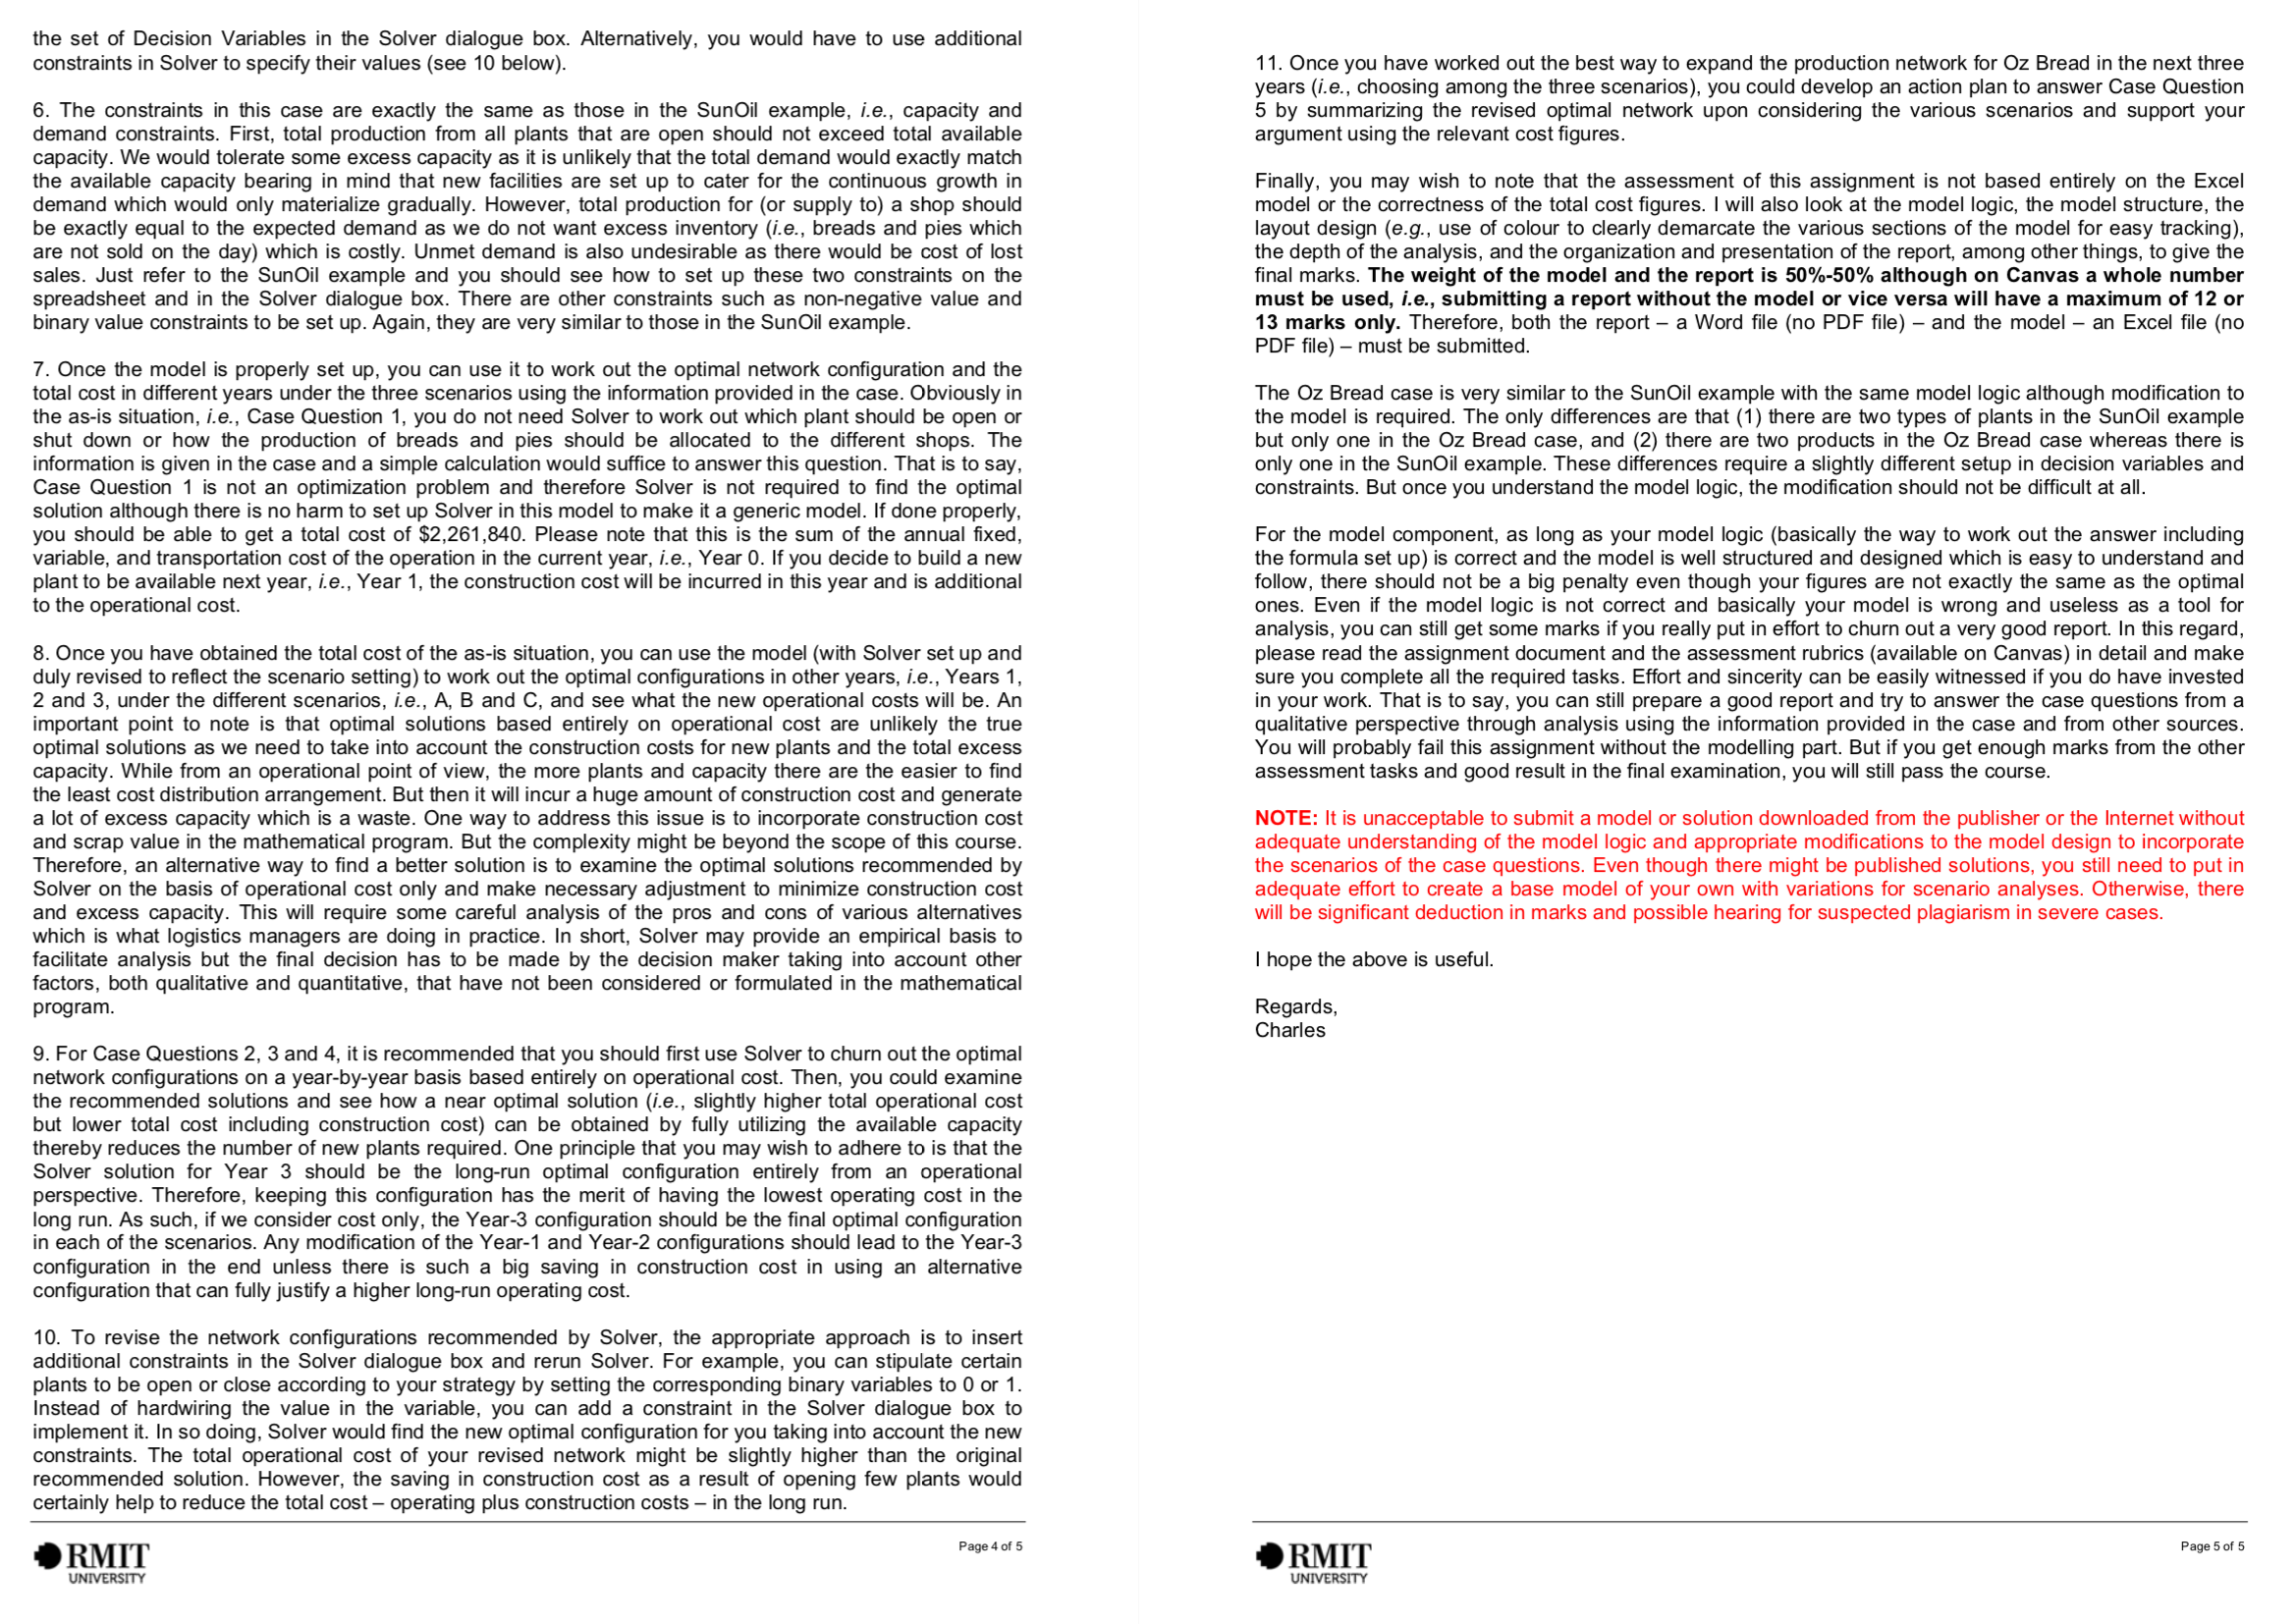
New Bakery for Oz Bread Background 02 Bread, a rapidly developing new bakery in Melbourne, is facing a critical supply chain problem. Mitchell McGuire, supply chain manager of Oz Bread, was asked by the boss to nd a solution. Given the continuous growth in business over the years, it is obvious that the current production and distribution network of the company needs to be restructured. Oz Bread started off with a single baking facility in Mentone. Every day, the freshly baked breads and pies are delivered to its shops located in Glen Waverley, Doncaster, Melbourne CBD, Thomastown, St. Albans, and Hoppers Crossing. Business is growing and soon the maximum daily production capacity at the Mentone baking plant will be reached. A quick decision on building one or more new baking plants could save the company significant amount of money in lost sales in the future. A new baking plant will take a year to build from planning to completion. For example, if 02 Bread decides in this year to build a new baking plant, the earliest date the new facility is available will be next year. 02 Bread was founded eight years ago and has been producing since then fresh breads and delicious gourmet meat pies for Melburnians. Current average daily demands for their breads and pies, which are relatively stable throughout the year, are shown in Table 1. The shops open 360 days a year. It is expected that the demands (breads and pies alike) at the existing shops will grow by the percentages shown in Table 1 for another three years before they become stabilized due to market saturation. For simplicity reason, it can be assumed that the increase in demand takes effect all of a sudden at the beginning of each year and now it is the beginning of the current year. At present, the company has one baking plant in Mentone which produces both products for the entire metropolitan area of Melbourne. Table 1 Average daily demand for breads and pies at 02 Bread in current year Glen Melbourne Hoppers Waverley Doncaster CBD Crossing 700 1000 1,500 IE- mo Growth in Year 1 12% 0% Growth in Yearz 6% Growth in Year 3 m The bread production line at the Mentone baking plant has a capacity of 6,000 units per day, an annualized maintenance and overhead cost of $200,000 a year, and a production cost of $0.3 per unit. The pie production line has a capacity of 4,000 units per day, an annualized maintenance and overhead cost of $300,000 a year, and a production cost of $05 per unit. 1|Page For simplicity reason, it can be assumed that the annualized maintenance and overhead cost will not be incurred if the production line is not running in the year. New Network Options Upon careful analysis of the locations of the existing shops and possible expansion of the company's business in the future, Mitchell has identified three suburbs l'rahran, Northcote, and Laverton North as potential sites for the new baking plants. At the new facilities, a bread production line or a pie production line or both can be set up. Using newer baking technologies, the new plants can run at lower costs. Production capacities, construction costs, annualized xed costs (Le maintenance and overhead costs), and unit production costs of the new plants are shown in grey in Table 2, It can be assumed that all these costs will remain unchanged in the next three years until the demands become stabilized. For the new plants, a saving of 30% from the construction cost can be achieved if only one production line is constructed However, once the plant with a single production line is built, it will not be possible to add another production line in the future. Shutting down the existing facility at Mentone can recover at most $100,000 in scrap value. If any of the new plant constructed at Prahran, Northcote, or Laverton North has to be shut down in the end due to underutilization, the maximum scrap value that can be retrieved is 10% of the construction cost. To make things simple, net present value is not considered in this case. Table 2 - Cost figures of the current and the potential new bakery facilities for Oz Bread Table 3 Existing and estimated transportation costs per unit for breads and pies (at current year) m Glen Melbourne Hoppers Plant Waverley Doncaster CBD Thomastown St. Albans Crossing Mentone (Exlstlng) $0.10 $0.12 $0.11 $0.20 $0.22 $0.24 Prahran $0.10 $0.12 $0.04 $0.12 $0.15 $0.17 Northcote $0.18 $0.16 $0.05 $0.04 $0.10 $0.11 Laverton North $0.22 $0.24 $0.10 $0.13 $0.04 $0.05 Plant Existing Potential Site Attribute Mentone Prahran Northcote Laverton North Capacity for Baking Breads per Day 6,000 6,000 7,000 7,500 Capacity for Baking Pies per Day 4,000 4,500 5,200 5,500 Construction Cost Already $1,200,000 $1,500,000 $1,600.000 built Annual Fixed Cost for Baking Breads $200,000 $220,000 $240,000 $240,000 Annual Fixed Cost for Baking Pies $300,000 $300,000 $320,000 $320,000 Variable Cost for Baking Breads $0.3 /unit $0.25 /unit $0.25 /unit $0.25 lunit Variable Cost for Baking Pies $0.5 /unit $0.45 [unit $0.45 [unit $0.45 lunit The current transportation costs per unit from the Mentone baking facility to the shops are shown in Table 3. The estimated transportation costs per unit (in current year) from the potential sites for the new plants to the shops are also shown in in grey Table 3. It can be assumed that these costs will remain more or less the same in the next three or more years ZlPage Based on the above infonnation, Mitchell has to decide for the next three years where to build the new plants and, if so, which production lines to put into the new facilities. Case Questions Assume you were Mitchell and you need to answer the following questions of your boss: 1. As-Is Situation: What is the current annual cost of serving all the shops from the Mentone baking plant? 2. Scenario A If the existing Mentone baking plant must be kept but not necessarily making both breads and cakes, what new plants would you recommend for the next three years? Where should they be built? What production lines should be included and how should the shops be served by the existing and the new baking plants? Make your recommendations on a year-by-year-basis (starting from Year 1). 3. Scenario B: If the existing Mentone baking plant must be scrapped because of its out-of- date production technology and new plants are to be built in other suburbs instead, what production network would you recommend and how should the shops be served by the new baking plants? Again, make your recommendations on a year-by-year-basis (starting from Year 1). 4. Scenario C: If only one production line is to be run at each baking plant at any time (Le, either baking breads or pies but not both), assuming you could use any plant including the existing one at Mentone, what production network would you recommend and how should the shops be served by the baking plants? Again, make your recommendations on a year-by- year-basis (starting from Year 1). 5. Action Plan: Taking into account the construction costs of the new plants and the scrap value of the existing plant and assuming the demand for breads and pies will become stabilized in three years, what is the network configuration you would recommend for Oz Bread for the long run and how should the shops be served by the baking plants? Analyze the total costs involved under the three scenarios taking into account the construction cost of the new plants and the scrap value of the existing baking facility at Mentone. Upon the 3 | P a g e analysis, generate an action plan for your nal recommendation on a year-by-year basis from Year 0 to Year 3 assuming the current year is Year 0, 115., what should Oz Bread do at the beginning of Years 0, 1, 2 and 3, if any. Notes: 1. In calculating the new demand, round to the nearest whole number. You can generate the Year 1 demand from the Year 0 figures, round them to integers and then use the rounded gures to generate the Year 2 gures. Repeating the same procedure, you can get the Year 3 gures. 2. For simplify reason, net present value, inflation, and depreciation, etc. can be ignored in the calculation. 3. You need to note that it might not be always desirable to make your recommendations entirely on the basis of the solutions given by Solver. This is because, for simplicity reason, your problem formulation might not include construction cost. As such, Solver would nd an optimized solution taking into account operating cost only. So, it might recommend using multiple plants to minimize total operating cost. You may come into a situation that a new plant is needed in one year but will no longer be required in another year leading to waste. Therefore, you are strongly recommended to use the Solver solutions as reference only and use your logical thinking to revise the year-by-year congurations. The objective is to minimize the long-run operating cost (referring to that of Year 3) while minimizing the total construction cost of the new facilities (from Year 0 to Year 2). In doing so, the operating costs of Year 1 and Year 2 may be higher than that of the Solver solutions for a particular scenario but on the whole the total construction cost and the long-run operating cost can be minimized. 4. In building new plants, you need to note that if only one production line is included at the beginning to save cost, it will not be possible to add another production line at a later stage. So, if a new plant is to run one production line in one year and then the other production line in another year, both production lines must be included when the plant is rst built. In other words, if both production lines in a plant will be used even though not at the same time, they must be provided right at the beginning when the plant is constructed. This will affect the total costs of the three scenarios as well as the action plan. Tips for OMGT 1053 Assignment 2 - New Bakery for Oz Bread Dear Students , Here are some tips to help you complete the quantitative assignment of the course . The assignment is about network optimization and will require the use of Solver to find the optimal solutions ." For this assignment , you will need to first develop a generic model on a spreadsheet and validate it . Then* with proper modifications in terms of model input , e . g., demand figures of a particular year , and constraints in Solver , e .g. , conditions that reflect the requirement of a particular scenario , the model can be used as a tool to help find the optimal solution for a particular year under a particular scenario . You can set up the model using the Sun Oil example as a reference . Despite the fact that there is only one product in the Sun Oil example but two in the Oz Bread case , both problems are identical in nature and are* categorized as Capacitated Facility Location Problems . It means that their mathematical formulations are very similar . Basically , the objective function is a cost functional comprising fixed and variable operating* costs . The constraints include demand constraint ( i.e., all demand must be met ) , capacity constraint ( i.e .. available capacity cannot be exceeded ) , non-negativity constraint ( i.e., Values of all variables cannot be* negative ) , binary constraint ( i.e. , facilities can either be open or close only ) or integer constraint ( number of facilities must be in whole number ) . The best way to go is to first create a model to represent the current or the as- is situation , i.e . , Year O . This will be needed to answer Case Question 1 . To work out the total operating cost for Year O , you do not need Solver at all . However , it will be good to use Solver to find the solution for you as well . This will allow you to ( 1 ) cross-check if your cost figure is correct and ( 11 ) have a generic model that can be copied and modified for scenario testing . As the layout of all the other models will be the same as that of the generic model , and the* Solver setups will be quite similar , you can simply copy the generic model and rename it to become another model for a particular scenario . For each year ( Year 1 to Year 3 ) of each scenario ( A . B and C ) . you will need one model to find the optimal network configuration . As mentioned above , this can be done easily by copying the validated generic model to a new spreadsheet and rename it . Next , alter the input parameters of the model and revise the constraints in the Solver dialogue box where appropriate to reflect the conditions of the scenario . Then , run Solver to get the optimal solution for that scenario . Basically , the workbook should comprise the at least 1 1 worksheets* Ten ( 10 ) of them should be models , each representing a particular situation or scenario in a particular year :" ( 1 ) One ( 1 ) model showing the current delivery arrangement and the total annual production and transportation cost ( i.e. , the as- is situation with only one baking facility in Mentone serving all shops ) ; ( 2 ) Three ( 3 ) models , one for each of the next three years , showing the optimal network configurations and total annual production and transportation costs under Scenario A lie., Keeping the existing baking facility at Mentone ) ;\\ ( 3 ) Three ( 3 ) models , one for each of the next three years , showing the optimal network configurations and total annual production and transportation costs under Scenario B ( i.e., closing the existing baking facility in Mentone and setting up new plants in other suburbs ) ; and* ( 4 ) Three ( 3 ) models , one for each of the next three years , showing the optimal network configurations. and total annual production and transportation costs under Scenario C ( i.e. , Setting up only one* production line at each baking facility , existing and new facilities alike ) . As Case Question 5 requires you to prepare a year-by -year action plan , i.e . . What facilities are to be built in which suburbs in which year , you will need to use one ( 1 ) worksheet as a summary of the findings . The sheet should detail the recommended action plan for Oz Bread in terms of the number and location of the new baking facilities to be built , existing facilities to be shut down , production lines to be set up , total amount* of excess capacity , and total cost incurred ( including construction , fixed , production and transportation costs less scrap value ) on a year- by - year basis for the next three years . NOTE : DO NOT use only one single spreadsheet or a summary report in the Excel workbook for everything* and expect the assessor to create the models for the different scenarios from scratch to check your answers Marks will be significantly deducted if the required ten models and one summary sheet are not provided . Unlike the SunOil example in which only operating cost is considered , we have to take into account* construction cost of the new plants in the Oz Bread case in deciding on the final long-run network* RMIT Page 1 of 5 UNIVERSITYconfiguration . Since for simplicity reason we are use the same formulation of the Sun Oil example for the Oz* Bread case , it means the model we created for the Oz Bread case does not have construction cost in the Daily Production and Distribution of Breads\\ objective function . Therefore , we cannot take the Solver solutions as the final configurations . It is because to Shop\\ Glen\\ \\Melbourne\\ Thomas -\\ \\Hoppers\\Line Open ( 1 )| Total Daily\\ Excess\\ minimize total operating cost , Solver may recommend the use of multiple facilities thus incurring a very large* Plant \\Waverley| Doncaster| CBD* _town* \\St . Albans Crossing\\ or Close ( 0 )| Production Capacity construction cost . In practice , we will try to minimize the total cost of both the long-run operation as well as Ventone the construction cost of the new plants . In other words , we do not want to have waste . Any configuration with rahan plants that are not fully utilized or needed in the long run should be avoided . In other words , we would need Northcote* to modify some of the Solver solutions ( which focus entirely on minimizing total operating cost ) and come up Laverton North with a plan that could minimize the long-run operating cost ( refer to that or Year 3 ) and the total construction \\Total Daily Supply cost during the first three years . As such , apart from the above 1 1 worksheets , you will probably need to Unmet Demand make use of the generic models to create some additional models to test the revised configurations ." Daily Production and Distribution of Pies* Here are some suggestions for you to set up the model :" shop\\ Glen* \\Melbourne\\ Thomas -\\ \\Hoppers \\Line Open ( 1 )| Total Daily\\ Excess* plant \\Waverley\\ Doncaster\\ CBD* town \\St . Albans \\Crossing\\ _\\or Close ( 0 )\\ _\\Production Capacity 7 . There are many ways to build the model . You are encouraged to use your own design keeping in mind \\Mentone that the model logic needs to be easy to follow and understand while the model layout is simple and clear* Prahan Proper colour scheme and legend should be used where appropriate to make the model self-explanatory . As Northcote an example , the tables for the input parameter , such as unit cost , plant capacity , and shop demand , could be Laverton North set up as shown in Figure 7 . To fill in the input parameter tables , you would need to study the case carefully Total Daily Supply and make full use of the data and information provided therein . Again as an example , the decision variable* tables , one for breads and one for pies , together with the constraints and the cost items , could also be set up \\Unmet Demand as shown in Figure 2. Of course , you can combine the two tables into one if you wish . I am just of the opinion that calculating the cost of the two products in separate tables may make the model easier to understand Annual Cost and follow . To calculate the fixed , variable , and transportation cost , the Excel SUMPRODUCT spreadsheet* Fixed Cost Legend function could be used ( refer to the Sun Oil example for how the formulas should be set up ) . You would need Variable Cost* Decision Variable to include the cost of both breads and pies in the calculation . The total cost ( on an annual basis ) is just a Transportation Cost constraint* summation of the fixed ( i.e., maintenance and overhead cost ) , the variable ( i.e., production cost ) , and the* Total Cost |Cost Item transportation cost . This will be the Objective cell referred to in the Solver dialogue box ." Figure 2 - Possible design of decision variable and cost tables for the Oz Bread case* Plant Cost and Capacity _Breads 2 . The major decision variables in this case should include the following :"\\ sald which plants ( nts ( or baking facilities ) to open and which ones to shut down ( Note : Building new annual Variable \\Daily Annual \\Variable* \\Daily facilities would incur significant construction cost while permanently shutting down existing facilities , Plant Fixed Cost| Cost / unit| Capacity\\ \\Fixed Cost\\ Cost / unit\\ \\Capacity even they were only built recently , would acquire some scrap value ) ; and* Mentone which plants should produce both breads and pies ( in that case , there is no savings in Prahar construction cost ) and which ones should only produce one product ( in that case , there will be a Northcote 30 % savings in construction cost for not setting up the facility to produce the other product ) . ( Note :" Laverton North The decision of setting up a single or dual production line facility has Y has to be made when the plant is constructed . Once built , a single production line facility cannot produce both products . However , a Daily Demand by Product dual production line facility can be used to produce one product only if needed . ) \\Glen \\Melbourne\\ Thomas -\\ \\Hoppers Shop Waverley| Doncaster\\ \\CBD town* \\St . Albans \\Crossing 3 . Obviously , these decision variables are binary variables similar to those in the SunOil example ( see Breads Chapter 5 of the prescribed textbook ) except that in the SunOil example there are two types of plants* whereas in the Oz Bread case there are two production lines instead . If considered easier to understand , You Pies Annual Growth could use a separate binary variable to represent the state of a plant , i.e., open or close , and another two binary variables - one for breads and one for pies - to represent whether only one or two production lines are open . I am just of the view that using the latter two binary variables would suffice in this case as whether Transportation Cost per Unit a plant is open or close can be worked out using the values of the two binary variables . Getting these* Shop\\ numbers correctly would help you work out the total fixed cost as mentioned in ( 1 ) above .* \\Glen \\Melbourne Thomas - Hoppers Plant Waverley| Doncaster| CBD _town \\St . Albans| Crossing\\ 4 . Please note that for those plants that need to be shut down in the long run ( i.e., not included in the* Mentone network configuration for many years ) , there would be scrap value . However , if the plant is just not Prahan operational for one year and then becomes operational again in another year , it is not a permanent shutdown Northcote but temporarily being laid idle . There would not be any production of either products , and consequently there* Laverton North* Legend _\\Input Parameter would be no fixed cost . But there would not be any scrap value either . These considerations are useful to help you develop the action plan for Oz Bread , i.e., answering Case Question 5 .` Figure 1 - Possible design of input parameter tables for the Oz Bread case* 5 . The other decision variables are of course the units of products ( both breads and pies ) to be produced from the opened plants and delivered to the different shops . Getting these numbers correctly would help you* work out the total variable cost and the total transportation cost as mentioned in ( 1 ) above . Please note that the values of all decision variables are to be determined by Solver . If you have to manually set the values of any of these variables to reflect certain conditions , they are no longer variables and should not be included in* ORMIL Page 2 Of 5 ORMIL Page 3 Of 5 UNIVERSITY UNIVERSITYhe set of Decision Variables in the Solver dialogue box . Alternatively , you would have to use additional constraints in Solver to specify their values ( see 10 below ) .` 7 7 . Once you have worked out the best way to expand the production network for Oz Bread in the next three years ( i.e., choosing among the three scenarios ) , you could develop an action plan to answer Case Question 6 . The constraints in this case are exactly the same as those in the SunOil example , i.e., capacity and 5 by summarizing the revised optimal network upon considering the various scenarios and support your demand constraints . First , total production from all plants that are open should not exceed total available argument using the relevant cost figures .` capacity . We would tolerate some excess capacity as it is unlikely that the total demand would exactly match the available capacity bearing in mind that new facilities are set up to cater for the continuous growth in Finally , you may wish to note that the assessment of this assignment is not based entirely on the Excel demand which would only materialize gradually . However , total production for ( or supply to ) a shop should model or the correctness of the total cost figures . I will also look at the model logic , the model structure , the be exactly equal to the expected demand as we do not want excess inventory ( i.e., breads and pies which layout design ( e .g., use of colour to clearly demarcate the various sections of the model for easy tracking )* are not sold on the day ) which is costly . Unmet demand is also undesirable as there would be cost of lost the depth of the analysis , and the organization and presentation of the report , among other things , to give the sales . Just refer to the SunOil example and you should see how to set up these two constraints on the* spreadsheet and in the Solver dialogue box . There are other constraints such as non-negative value and* final marks . The weight of the model and the report is 50 % - 50% although on Canvas a whole number binary value constraints to be set up . Again , they are very similar to those in the Sun Oil example ." must be used , i.e., submitting a report without the model or vice versa will have a maximum of 12 or 13 marks only . Therefore , both the report - a Word file ( no PDF file ) - and the model - an Excel file ( no PDF file ) - must be submitted . 7 . Once the model is properly set up , you can use it to work out the optimal network configuration and the total cost in different years under the three scenarios using the information provided in the case . Obviously in The Oz Bread case is very similar to the Sun Oil example with the same model logic although modification to the as-is situation , i.e., Case Question 1 , you do not need Solver to work out which plant should be open or the model is required . The only differences are that ( 1 ) there are two types of plants in the Sun Oil example* shut down or how the production of breads and pies should be allocated to the different shops . The but only one in the Oz Bread case , and ( 2 ) there are two products in the Oz Bread case whereas there is information is given in the case and a simple calculation would suffice to answer this question . That is to say , only one in the SunOil example . These differences require a slightly different setup in decision variables and* Case Question I is not an optimization problem and therefore Solver is not required to find the optimal constraints . But once you understand the model logic , the modification should not be difficult at all ." solution although there is no harm to set up Solver in this model to make it a generic model . If done properly* you should be able to get a total cost of $2 , 261 , 840 . Please note that this is the sum of the annual fixed , For the model component , as long as your model logic ( basically the way to work out the answer including* variable , and transportation cost of the operation in the current year , i.e. . Year O . If you decide to build a new the formula set up ) is correct and the model is well structured and designed which is easy to understand and plant to be available next year , I.e., Year 1 , the construction cost will be incurred in this year a year and is additional follow , there should not be a big penalty even though your figures are not exactly the same as the optimal to the operational cost .\\ ones . Even if the model logic is not correct and basically your model is wrong and useless as a tool for 8 . Once you have obtained the total cost of the as- is situation , you can use the model ( with Solver set up and analysis , You can still get some marks if you really put in effort to churn out a very good report . In this regard , please read the assignment document and the assessment rubrics ( available on Canvas ) in detail and make* duly revised to reflect the scenario setting ) to work out the optimal configurations in other years , i.e ., Years 1 . sure you complete all the required tasks . Effort and sincerity can be easily witnessed if you do have invested 2 and 3 , under the different scenarios , i.e., A , B and C , and see what the new operational costs will be . An in your work . That is to say , you can still prepare a good report and try to answer the case questions from a important point to note is that optimal solutions based entirely on operational cost are unlikely the true* qualitative perspective through analysis using the information provided in the case and from other sources . optimal solutions as we need to take into account the construction costs for new plants and the total excess capacity . While from an operational point of view , the more plants and capacity there are the easier to find You will probably fail this assignment without the modelling part . But if you get enough marks from the other assessment tasks and good result in the final examination , you will still pass the course ." the least cost distribution arrangement . But then it will incur a huge amount of construction cost and generate* a lot of excess capacity which is a waste . One way to address this issue is to incorporate construction Cost NOTE : It is unacceptable to submit a model or solution downloaded from the publisher or the Internet without* and scrap value in the mathematical program . But the complexity might be beyond the scope of this course . Therefore , an alternative way to find a better solution is to examine the optimal solutions recommended by adequate understanding of the model logic and appropriate modifications to the model design to incorporate* Solver on the basis of operational cost only and make necessary adjustment to minimize construction cost the scenarios of the case questions . Even though there might be published solutions , you still need to put in adequate effort to create a base model of your own with variations for scenario analyses . Otherwise , there* and excess capacity . This will require some careful analysis of the pros and cons of various alternatives will be significant deduction in marks and possible hearing for suspected plagiarism in severe cases ." which is what logistics managers are doing in practice . In short , Solver may provide an empirical basis to facilitate analysis but the final decision has to be made by the decision maker taking into account other I hope the above is useful . actors , both qualitative and quantitative , that have not been considered or formulated in the mathematical program ." Regards Charles 9 . For Case Questions 2 , 3 and 4 , it is recommended that you should first use Solver to churn out the optimal network configurations on a year- by -year basis based entirely on operational cost . Then , you could examine* the recommended solutions and see how a near optimal solution ( i.e., Slightly higher total operational cost but lower total cost including construction cost ) can be obtained by fully utilizing the available capacity* thereby reduces the number of new plants required . One principle that you may wish to adhere to is that the solver solution for Year 3 should be the long-run optimal configuration entirely from an operational perspective . Therefore , keeping this configuration has the merit of having the lowest operating cost in the* long run . As such , if we consider cost only , the Year- 3 configuration should be the final optimal configuration* in each of the scenarios . Any modification of the Year - 1 and Year - 2 configurations should lead to the Year - 3 configuration in the end unless there is such a big saving in construction cost in using an alternative configuration that can fully justify a higher long-run operating cost .\\ 10 . To revise the network configurations recommended by Solver , the appropriate approach is to insert additional constraints in the Solver dialogue box and rerun Solver . For example , you can stipulate certain plants to be open or close according to your strategy by setting the corresponding binary variables to O or 1 . instead of hardwiring the value in the variable , you can add a constraint in the Solver dialogue box to implement it . In so doing , Solver would find the new optimal configuration for you taking into account the new constraints . The total operational cost of your revised network might be slightly higher than the original recommended solution . However , the saving in construction cost as a result of opening few plants would certainly help to reduce the total cost - operating plus construction costs - in the long run .` DRMIL Page 4 of 5 DRMIL Page 5 of 5\\ UNIVERSITY UNIVERSITY\\