

Question: I am lost two top are data bottom are questions any help would be appricated In [1] : import pandas as pd import numpy as
I am lost two top are data bottom are questions any help would be appricated
![would be appricated In [1] : import pandas as pd import numpy](https://s3.amazonaws.com/si.experts.images/answers/2024/06/667f0c49f3a3b_249667f0c49d57b6.jpg)
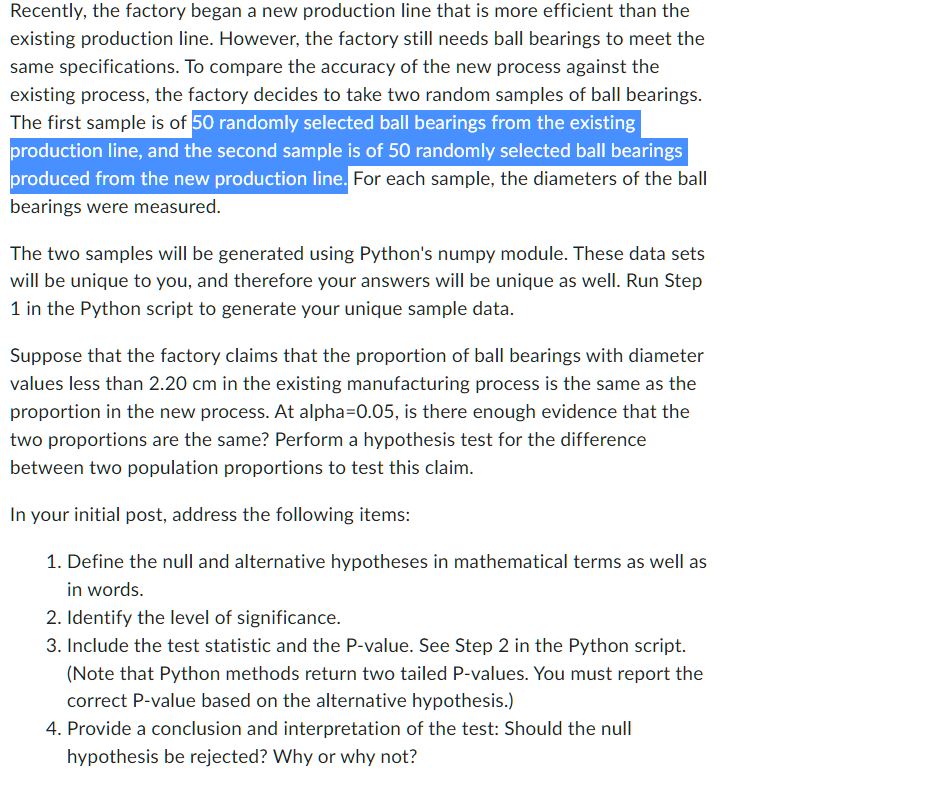
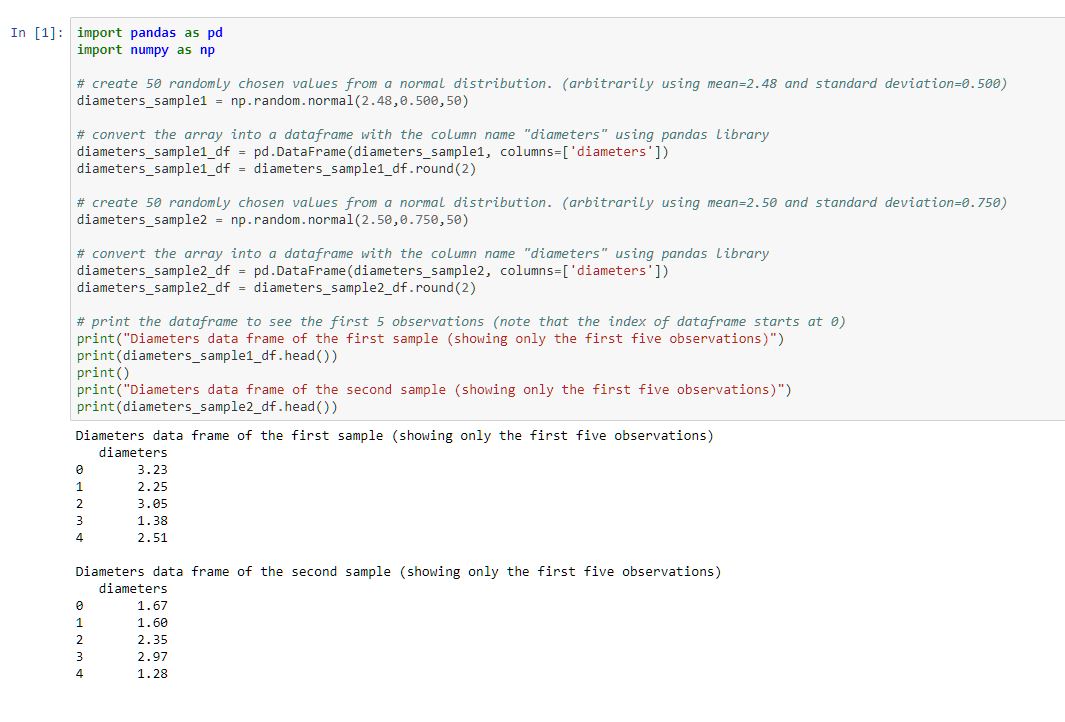
In [1] : import pandas as pd import numpy as np # create 50 randomly chosen values from a normal distribution. (arbitrarily using mean=2. 48 and standard deviation=0. 500) diameters_sample1 = np. random. normal (2. 48, 0.500, 50) # convert the array into a dataframe with the column name "diameters" using pandas Library diameters_sample1_df = pd. DataFrame (diameters_sample1, columns=['diameters' ]) diameters_sample1_df = diameters_sample1_df . round(2) # create 50 randomly chosen values from a normal distribution. (arbitrarily using mean=2.50 and standard deviation=0. 750) diameters_sample2 = np. random. normal(2.50, 0.750, 50) # convert the array into a dataframe with the column name "diameters" using pandas Library diameters_sample2_df = pd. DataFrame (diameters_sample2, columns=['diameters' ]) diameters_sample2_of = diameters_sample2_df . round(2) # print the dataframe to see the first 5 observations (note that the index of dataframe starts at 0) print("Diameters data frame of the first sample (showing only the first five observations)") print (diameters_sample1_df . head( ) ) print ( ) print ("Diameters data frame of the second sample (showing only the first five observations)") print (diameters_sample2_df . head( ) ) Diameters data frame of the first sample (showing only the first five observations) diameters 3.23 2.25 3.05 1. 38 2.51 Diameters data frame of the second sample (showing only the first five observations) diameters 1. 67 1.60 2.35 2.97 1.28\fRecently, the factory began a new production line that is more efficient than the existing production line. However, the factory still needs ball bearings to meet the same specifications. To compare the accuracy of the new process against the existing process, the factory decides to take two random samples of ball bearings. The first sample is of 50 randomly selected ball bearings from the existing production line, and the second sample is of 50 randomly selected ball bearings produced from the new production line. For each sample, the diameters of the ball bearings were measured. The two samples will be generated using Python's numpy module. These data sets will be unique to you, and therefore your answers will be unique as well. Run Step 1 in the Python script to generate your unique sample data. Suppose that the factory claims that the proportion of ball bearings with diameter values less than 2.20 cm in the existing manufacturing process is the same as the proportion in the new process. At alpha=0.05, is there enough evidence that the two proportions are the same? Perform a hypothesis test for the difference between two population proportions to test this ciaim. In your initial post. address the following items: 1. Define the null and alternative hypotheses in mathematical terms as well as in words. 2. ldentify the level of significance. 3. Include the test statistic and the P-value. See Step 2 in the Python script. (Note that Python methods return two tailed Pevalues. You must report the correct Pvalue based on the alternative hypothesis.) 4. Provide a conclusion and interpretation of the test: Should the null hypothesis be rejected? Why or why not
Step by Step Solution
There are 3 Steps involved in it

Get step-by-step solutions from verified subject matter experts