

Question: I am missing two lines for this Shiny App to work. I'm having issue with the ui main panel I believe. I am trying to
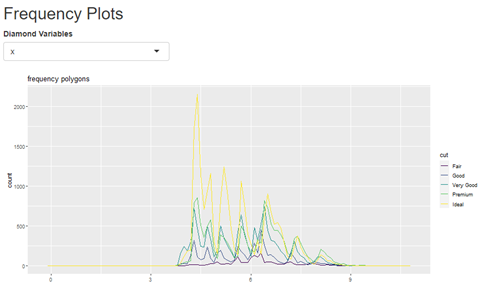
I am missing two lines for this Shiny App to work. I'm having issue with the ui main panel I believe. I am trying to get the graph shown below, but my code for R doesn't work yet. What I am missing?
library(tidyverse)
library(shiny)
diamonds%>%
select(carat,price,x,y,z) -> diamonds1
diamonds1
ui
titlePanel("Frequency Plots"),
)
server
output$plot
ggplot(diamonds, mapping = aes(x = .data[[input$DVvar]], color = cut)) +
geom_freqpoly(binwidth = 0.1) +
ggtitle("frequency polygons")
})
}
shinyApp(ui = ui, server = server)
\f
Step by Step Solution
There are 3 Steps involved in it
1 Expert Approved Answer
Step: 1 Unlock

Question Has Been Solved by an Expert!
Get step-by-step solutions from verified subject matter experts
Step: 2 Unlock
Step: 3 Unlock