Question: I am needing help determining how to up my group's score in year 8 in the GLO-BUS simulation. Below are the current standings after year
I am needing help determining how to up my group's score in year 8 in the GLO-BUS simulation. Below are the current standings after year 7 (I am in A Company):
Product Design:
AC Camera Marketing:
UAV Drone Marketing:
Corporate Citizenship:
Compensation and Facilities:
Finance and Cash Flow:
Key Performance Measures:
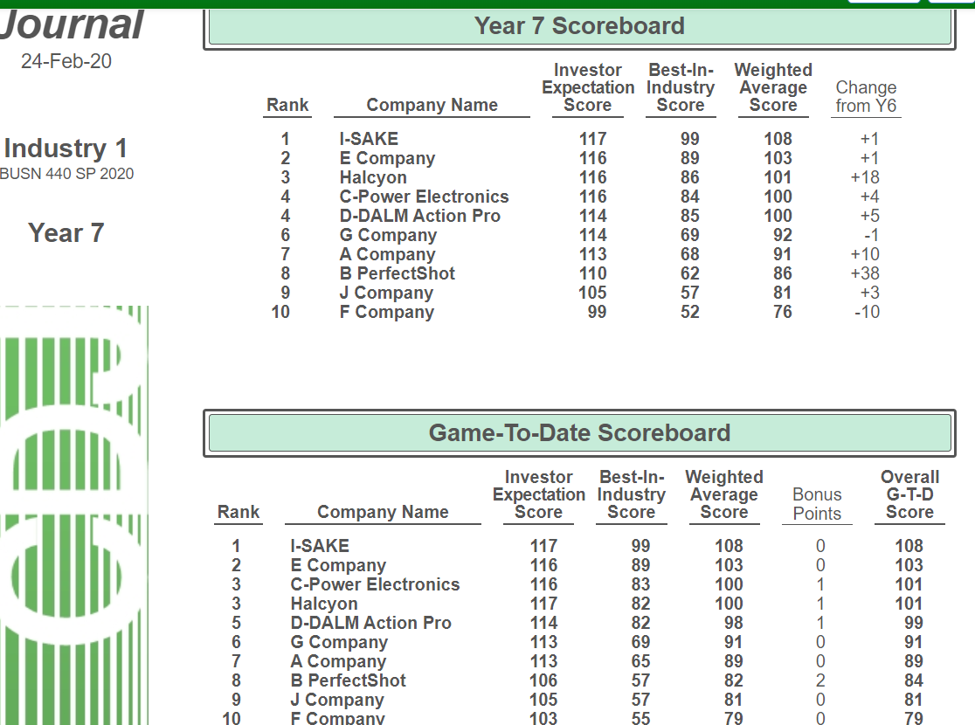
Year 7 Scoreboard:
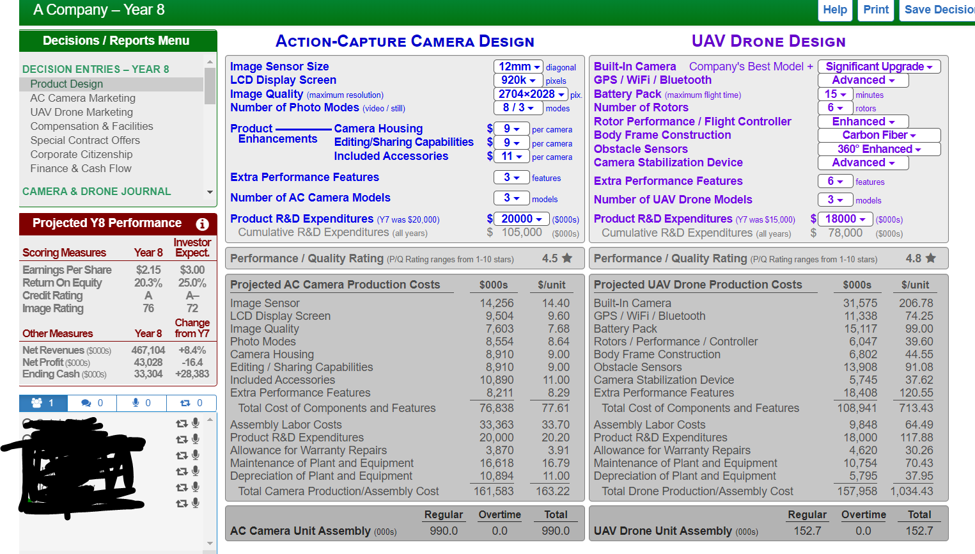
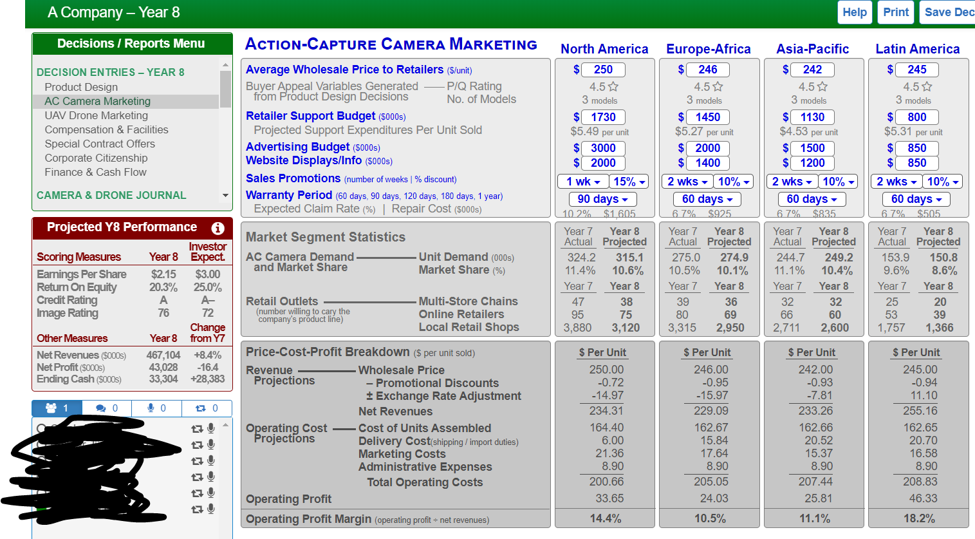
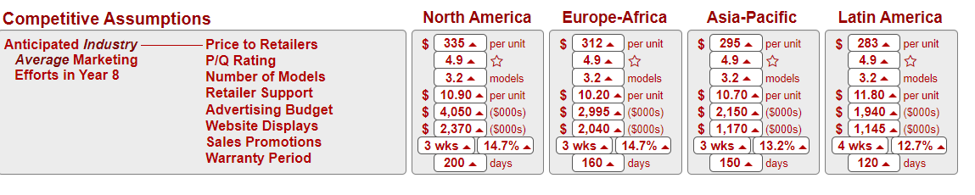
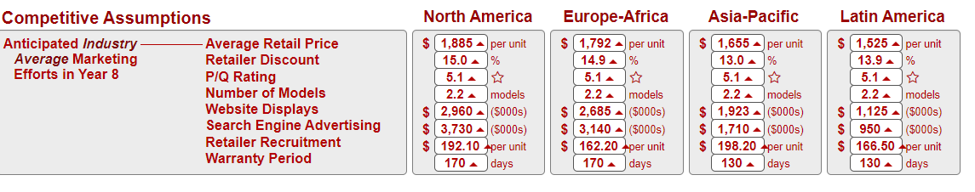
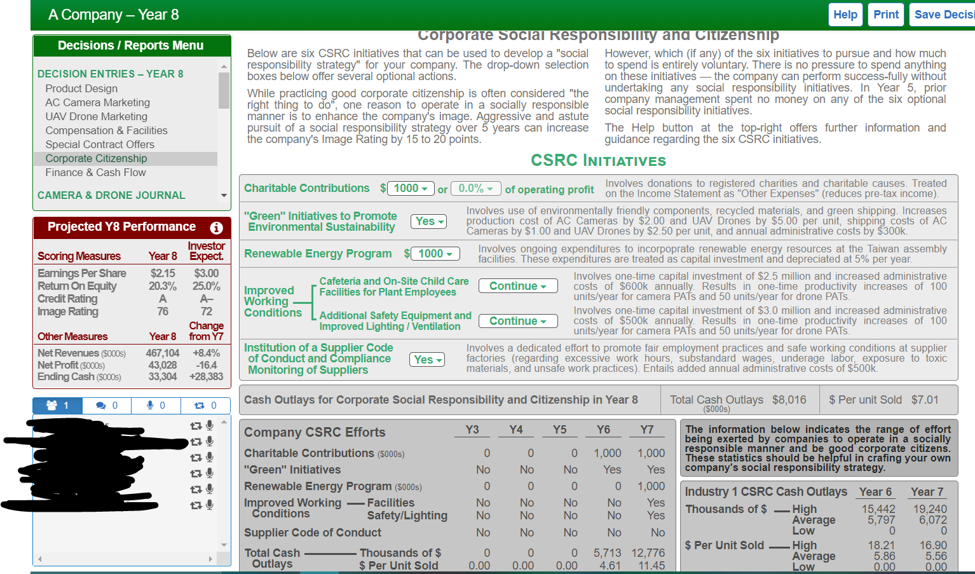
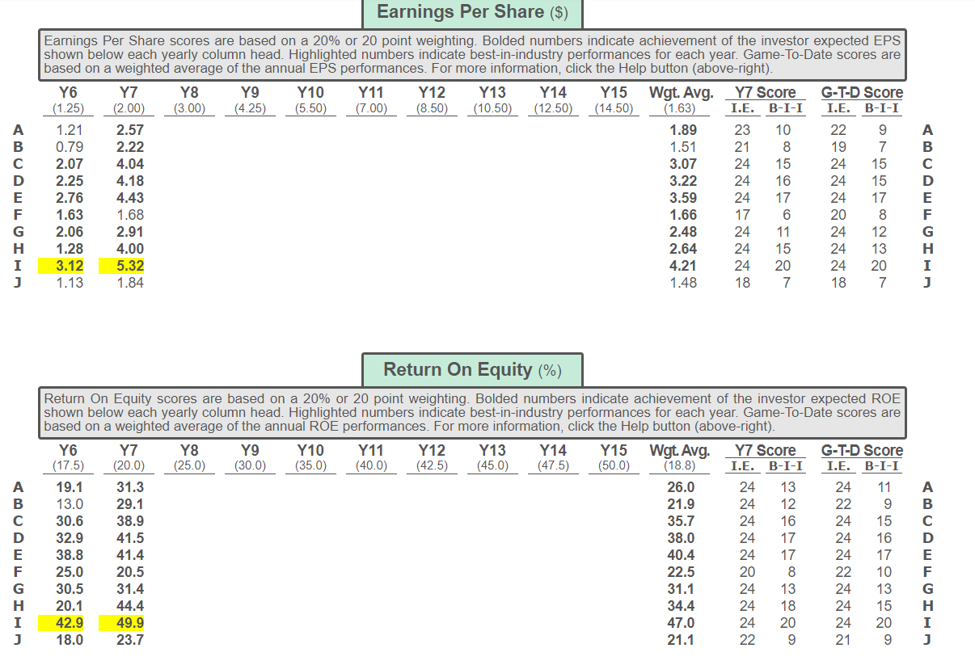
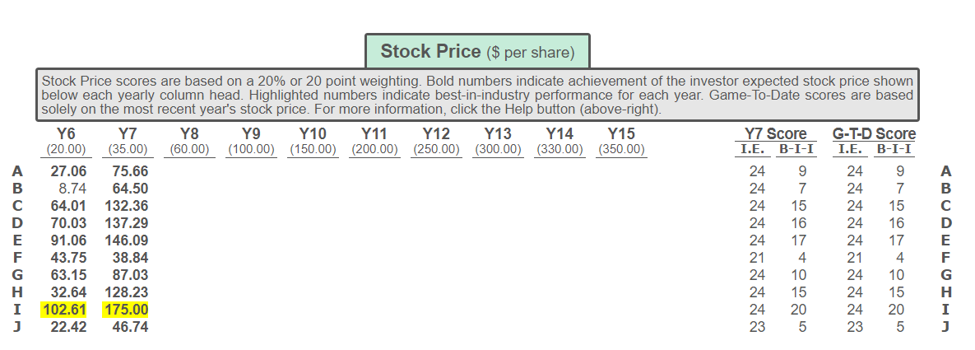
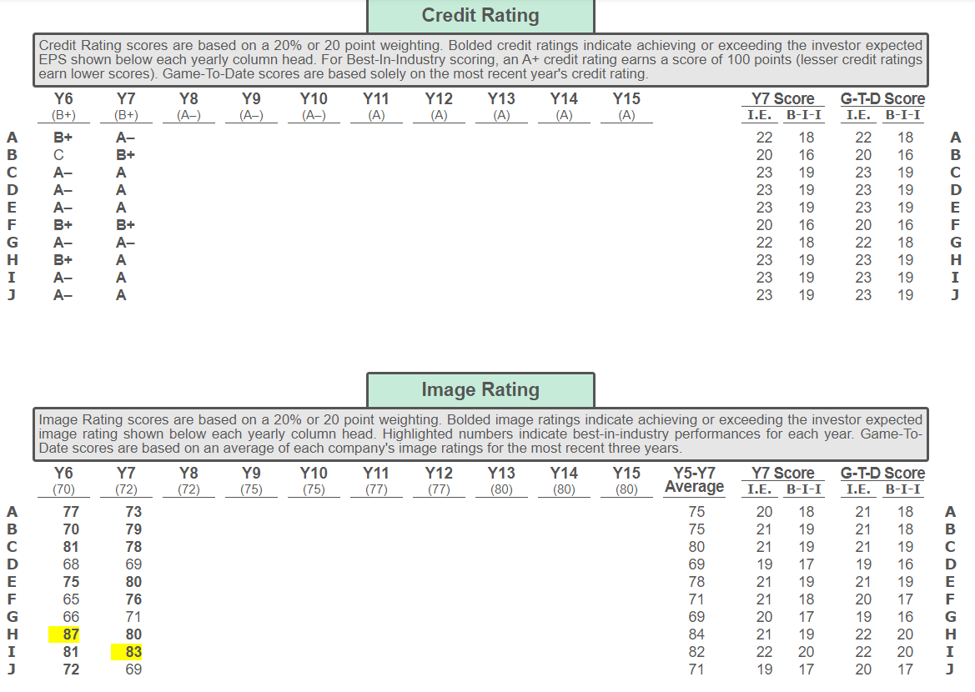
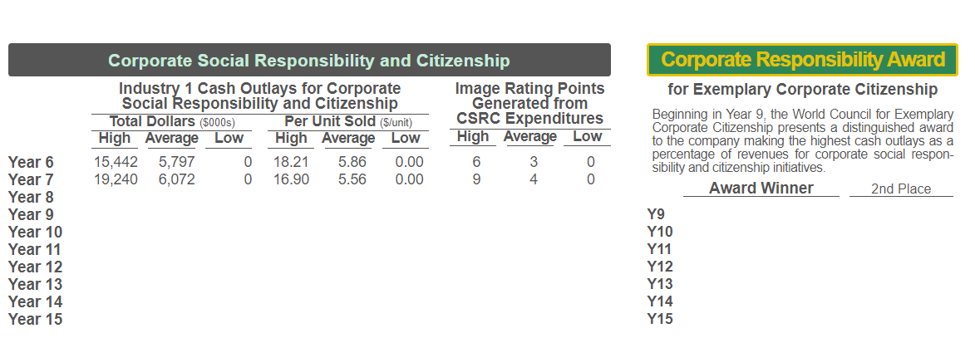
A Company Year 8 Help Print Save Decisio Decisions / Reports Menu DECISION ENTRIES YEAR 8 Product Design AC Camera Marketing UAV Drone Marketing Compensation & Facilities Special Contract Offers Corporate Citizenship Finance & Cash Flow ACTION-CAPTURE CAMERA DESIGN Image Sensor Size 12mm diagonal LCD Display Screen 920k - povels Image Quality (maximum resolution) 2704x2028 pix Number of Photo Modes (video/sil) 8/3 - modes Product Camera Housing S 9 - per camera Enhancements Edition/Sharina Canabilities Editing/Sharing Capabilities S $ 9- . per camera Included Accessories $ 11 per camera Extra Performance Features 3- features Number of AC Camera Models 3- models Product R&D Expenditures (Y7 was $20,000) $ 20000 5000s) Cumulative R&D Expenditures (all years) $ 105,000 (5000s) Performance / Quality Rating (PO Rating ranges from 1-10 stars) 4.5 * UAV DRONE DESIGN Built-In Camera Company's Best Model + Significant Upgrade - GPS / WiFi / Bluetooth Advanced Battery Pack (maximum flight time) 15 minutes Number of Rotors 6 ) rotors Rotor Performance / Flight Controller Enhanced - Body Frame Construction Carbon Fiber Obstacle Sensors 360 Enhanced - Camera Stabilization Device Advanced- Extra Performance Features 6 ) features Number of UAV Drone Models 3 models Product R&D Expenditures (Y7 was $15.000) $ 18000 (5000s) Cumulative R&D Expenditures (all years) $ 78,000 (5000s) CAMERA & DRONE JOURNAL Projected Y8 Performance Performance / Quality Rating (P/Q Rating ranges from 1-10 stars) 4.8 * Scoring Measures Eamings Per Share Return On Equity Credit Rating Image Rating Year 8 $2.15 20.3% S/unit Investor Expect. $3.00 25.0% A- 72 Change from Y7 +8.4% -164 +28,383 Year Other Measures Net Revenues (50008) Net Profit (S0005) Ending Cash (5000) 467,104 43,028 33,304 Projected AC Camera Production Costs Image Sensor LCD Display Screen Image Quality Photo Modes Camera Housing Editing/ Sharing Capabilities Included Accessories Extra Performance Features Total Cost of Components and Features Assembly Labor Costs Product R&D Expenditures Allowance for Warranty Repairs Maintenance of plant and Equipment Depreciation of Plant and Equipment Total Camera Production/Assembly Cost Regular AC Camera Unit Assembly (000) 990.0 $000s 14,256 9,504 7,603 8,554 8,910 8,910 10,890 8,211 76,838 33,363 20.000 3,870 16,618 10,894 161,583 Projected UAV Drone Production Costs Built-In Camera GPS / WiFi / Bluetooth Battery Pack Rotors / Performance / Controller Body Frame Construction Obstacle Sensors Camera Stabilization Device Extra Performance Features Total Cost of Components and Features Assembly Labor Costs Product R&D Expenditures Allowance for Warranty Repairs Maintenance of Plant and Equipment Depreciation of Plant and Equipment Total Drone Production/Assembly Cost 14.40 9.60 7.68 8.64 9.00 9.00 11.00 8.29 77.61 33.70 20.20 3.91 16.79 11.00 163.22 1 000 $000 $/unit 31,575 206.78 11,338 74.25 15, 117 99.00 6,047 39.60 6.802 44.55 13,908 91.08 5,745 37.62 18,408 120.55 108,941 713.43 9,848 64.49 18,000 117.88 4,620 30.26 10,754 70.43 5,795 37.95 157,958 1,034.43 ta ! Overtime 0.0 Total 990.0 UAV Drone Unit Assembly (000) Regular 152.7 Overtime 0. 0 Total 1 52.7 A Company Year 8 Help Print Save Dec Decisions / Reports Menu DECISION ENTRIES - YEAR 8 Product Design AC Camera Marketing UAV Drone Marketing Compensation & Facilities Special Contract Offers Corporate Citizenship Finance & Cash Flow ACTION-CAPTURE CAMERA MARKETING Average Wholesale Price to Retailers (S/unit) Buyer Appeal Variables Generated P/Q Rating from Product Design Decisions No. of Models Retailer Support Budget (5000s) Projected Support Expenditures Per Unit Sold Advertising Budget (5000s) Website Displays/Info (5000s) Sales Promotions (number of weeks % discount) Warranty Period (60 days. 90 days, 120 days, 180 days, 1 year) Expected Claim Rate(%) Repair Cost (5000s) North America $ 250 4.5 3 models $ 1730 $5.49 per unit $ 3000 $ 2000 1 wk - 15% 90 days 10 2% $1.605 Year 7 Year 8 Actual Projected 324.2 315.1 11.4% 10.6% Year 7 Year 8 47 38 95 75 3,880 3,120 Europe-Africa $ 246 4.5+ 3 models $ 1450 $5.27 per unit $ 2000 $ 1400 2 wks - 10% 60 days ) 67% 925 Year 7 Years Actual Projected 275.0 274.9 10.5% 10.1% Year 7 Year 8 Asia-Pacific $ 242 4.5+ 3 models $ 1130 $4.53 per unit $ 1500 $ 1200 2 wks - 10%- 60 days - 67% $835 Year 7 Year 8 Actual Projected 244.7 249.2 11.1% 10.4% Year 7 Year 8 32 66 60 2,711 2,600 Latin America $ 245 4.5 3 models $ 800 $5.31 per unit $ 850 $ 850 | 2 wks - 10% - 60 days 67% $505 Year 7 Year 8 Actual Projected 153.9 150.8 9.6% 8.6% Year 7 Year 8 25 20 53 39 1,757 1,366 CAMERA & DRONE JOURNAL Market Segment Statistics AC Camera Demand- and Market Share Unit Demand (000s) Market Share (%) Projected Y8 Performance i Investor Scoring Measures Year 8 Expect. Earnings Per Share $2.15 $3.00 Retum On Equity 20.3% 25.0% Credit Rating A- Image Rating 72 Change Other Measures Year 8 from Y7 Net Revenues (50008) 467,104 +8.4% Net Profit (S0005) 43,028 -16.4 Ending Cash (5000s) 33,304 +28,383 39 Retail Outlets (number willing to cary the company's product line) Multi-Store Chains Online Retailers Local Retail Shops 80 3,315 69 2,950 DO Price-Cost-Profit Breakdown (per unit sold) Revenue - Wholesale Price Projections - Promotional Discounts + Exchange Rate Adjustment Net Revenues Operating Cost - Cost of Units Assembled Projections Delivery Costshipping/import duties) Marketing Costs Administrative Expenses Total Operating costs Operating Profit Operating Profit Margin (operating profit + net revenues) $ Per Unit 250.00 -0.72 - 14.97 234.31 164.40 6.00 21.36 8.90 200.66 33.65 $ Per Unit 246.00 -0.95 -15.97 229.09 162.67 15.84 17.64 8.90 205.05 24.03 10.5% $ Per Unit 242.00 -0.93 -7.81 233.26 162.66 20.52 15.37 8.90 207.44 25.81 11.1% $ Per Unit 245.00 -0.94 11.10 255.16 162.65 20.70 16.58 8.90 208.83 46.33 18.2% 14.4% Europe-Africa $ 312 per unit 49 Competitive Assumptions Anticipated Industry Price to Retailers Average Marketing P/Q Rating Efforts in Year 8 Number of Models Retailer Support Advertising Budget Website Displays Sales Promotions Warranty Period North America $ 335 per unit 4.9 3.2 models $ 10.90 per unit $ 4,050 (5000s) $ 2,370 (5000s) 3 wks - 14.7% ( 200 days 3.2 models $ 10.20 per unit $ 2,995. (5000s) $ 2,040 (5000s) 3 wks 14.7% (160 days Asia-Pacific $ 295 per unit 4.9 3.2. models $ 10.70 per unit $ 2,150 (5000s) $ 1,170 (5000s) 3 wks 13.2% 150 days Latin America $ 283 per unit 4.9 3.2 models $ 11.80 per unit $ 1,940 (5000s) $ (1,145 (5000s) 4 wks - I 12.7% 120 days A Company - Year 8 Help Print Save Decisi Decisions / Reports Menu UAV DRONE MARKETING DECISION ENTRIES YEAR 8 Product Design AC Camera Marketing UAV Drone Marketing Compensation & Facilities Special Contract Offers Corporate Citizenship Finance & Cash Flow Average Retail Price (Slunit to direct online customers) Discount Offered to 3rd-Party Online Retailers Buyer Appeal Variables Generated P/Q Rating from Product Design Decisions No. of Models Website Product Displays / Info (5000s) Search Engine Advertising (5000s) Retailer Recruitment / Support Budget (5000s) Retailer Recruitment / Support (per 3rd party unit sold) Warranty Period (60 days. 90 days, 120 days, 180 days, 1 year) Expected Claim Rate (%) Repair Cost (5000) North America $ 1800 10%- 4.87 3 models $ 3000 $ 3000 $ 1300 $123.81 per unit 90 days 11.2% $1.650.0 Europe-Africa $ 1722 15% - 4.8 3 models $ 2000 $ 1700 $ 1000 $75.19 per unit 60 days ) 72% S901.0 Year 7 Year 8 Actual Projected 20.2 28.9 7.5 13.3 27.7 42.2 6.0% 8.3% Year 7 Year 8 33 26 Asia-Pacific $ 1500 10%- 4.87 3 models $ 1100 $ 1200 $ 700 $82.35 per unit 90 days 11.2% $1.200.0 J Year 7 Year 8 Actual Projected 19.1 27.1 3.4 8.5 22.5 35.6 7.3% 9.9% Year 7 Year 8 Latin America $ 1415 10%- 4.8 3 models $ 1200 $ 900 $ 600 $100.00 per unit 90 days - 11.2% 870.0 Year 7 Year 8 Actual Projected 13.9 20.0 3.1 6.0 17.0 26.0 8.1% 10.8% Year 7 Year 8 19 16 CAMERA & DRONE JOURNAL Market Segment Statistics UAV Drone Demand - Direct (thru company website) and Market Share 3rd-Party (thru online retailers) Total Unit Demand (000s) Market Share (%) Projected Y8 Performance 0 Investor Scoring Measures Year 8 Expect. Earnings Per Share $2.15 $3.00 Retum On Equity 20.3% 25.0% Credit Rating AA- Image Rating 76 72 Change Other Measures Year 8 from Y7 Net Revenues (S000S) 467,104 +8.4% Net Profit (5000s) 43,028 -16.4 Ending Cash (5000s) 33,304 +28,383 Year 7 Year 8 Actual Projected 41.7 38.4 8.0 10.5 49.7 48.9 9.6% 8.4% Year 7 Year 8 42 33 Online Retailers (willing to carry the company's product line) 27 22 Price-Cost-Profit Breakdown ($ per unit sold) 31 Revenue -Selling Price Projections + Exchange Rate Adjustment Net Revenues Operating Cost Cost of Units Assembled Projections Delivery Cost (shipping / Import duties) Marketing Costs Administrative Expenses Total Operating costs Operating Profit Operating Profit Margin (operating profit + net revenues) Online Online Sales Retailers 1,800.00 1,620.00 -108.10 -97.33 1,691.90 1,522.67 1,037.81 1,038.29 62.50 12.48 156.25 123.81 11.74 11.81 1,268.31 1,186.38 423.59 336.29 25.0% 22.1% 24.5% Direct 3rd-Party Online Online Sales Retailers 1,722.00 1,463.68 - 112.18 -95.34 1,609.82 1,368.35 1,025.64 1,025.34 131.38 71.05 128.03 75.19 11.76 11.73 1,296.82 1,183.31 313.00 185.04 19.4% 13.5% 17.8% Direct3rd-Party Online Online Sales Retailers 1,500.00 1,350.00 -48.60 43.76 1,451.40 1,306 24 1,037.34 1,039.53 152.51 93.53 84.87 82.35 11.73 11.76 1,286.46 1,227.18 164.94 79.06 11.4% 6.1% 10.2% Direct 3rd-Party Online Online Sales Retailers 1,415.00 1,273,50 64.35 58.00 1,479.35 1,331,50 1,038.05 1,036.67 147.40 88.83 105.00 100.00 11.75 11.67 1,302.20 1,237.17 177.15 94.33 12.0% 7.1% 10.9% Competitive Assumptions Anticipated Industry - Average Retail Price Average Marketing Retailer Discount Efforts in Year 8 P/Q Rating Number of Models Website Displays Search Engine Advertising Retailer Recruitment Warranty Period North America $ 1,885 per unit 15.0 % 5.1 . * 2.2 A models $ 2,960 (5000s) $ 3,730 (5000s) $ 192.10 per unit 170 days Europe Africa $ 1,792 per unit | 14.9 % 5.1 . (2.2 models $ 2,685 ($000s) $ 3,140 - (5000s) $ 162.20 per unit 170 . days Asia-Pacific $ 1,655 per unit 13.0 % (5.1 . 2.2 A models $ 1,923 (5000s) $ 1,710 (5000s) $ 198.20 per unit 130 days Latin America $ 1,525 per unit 13.9 % 5.1 2.2 . models $ 1,125 (5000s) $ 950 (5000s) $ 166.50 per unit 130 days A Company Year 8 Help Print Save Decis Decisions / Reports Menu DECISION ENTRIES YEAR 8 Product Design AC Camera Marketing UAV Drone Marketing Compensation & Facilities Special Contract Offers Corporate Citizenship Finance & Cash Flow Corporate Social Responsibility and Citizenship Below are six CSRC initiatives that can be used to develop a "social However, which (if any) of the six initiatives to pursue and how much responsibility strategy" for your company. The drop-down selection to spend is entirely voluntary. There is no pressure to spend anything boxes below offer several optional actions. on these initiatives the company can perform success-fully without While practicing good corporate citizenship is often considered "the undertaking any social responsibility initiatives. In Year 5, prior company management spent no money on any of the six optional right thing to do", one reason to operate in a socially responsible manner is to enhance the company's image. Aggressive and astute social responsibility initiatives. pursuit of a social responsibility strategy over 5 years can increase The Help button at the top-right offers further information and the company's Image Rating by 15 to 20 points. guidance regarding the six CSRC initiatives. CSRC INITIATIVES CAMERA & DRONE JOURNAL Projected Y8 Performance 6 Investor Scoring Measures Year 8 Expect. Earnings Per Share $2.15 $3.00 Return On Equity 20.3% 25.0% Credit Rating A- Image Rating 76 72 Change Other Measures Year 8 from Y7 Net Revenues (50008) 467,104 +8.4% Net Profit (5000) 43,028 -164 Ending Cash (5000s) 33,304 +28,383 Involves donations to registered charities and charitable causes. Treated Charitable Contributions $[ 1000 or 0.0% of operating profit on the Income Statement as "Other Expenses" (reduces pre-tax income). "Green" Initiatives to promote Involves use of environmentally friendly components, recycled materials, and green shipping. Increases (Yes production cost of AC Cameras by $2.00 and UAV Drones by $5.00 per unit, shipping costs of AC Environmental Sustainability Cameras by $1.00 and UAV Drones by $2.50 per unit, and annual administrative costs by $300k Renewable Energy Program $ 1000 involves ongoing expenditures to incorpoprate renewable energy resources at the Taiwan assembly facilities. These expenditures are treated as capital investment and depreciated at 5% per year. Involves one-time capital investment of $2.5 million and increased administrative Cafeteria and On-Site Child Care Continue c osts of SBOOK annually Results in one-time productivity increases of 100 Improved Facilities for Plant Employees units/year for camera PATS and 50 units/year for drone PATS. Working Conditions Involves one-time capital investment of $3.0 million and increased administrative Additional Safety Equipment and continue costs of $500k annually Results in one-time productivity increases of 100 Improved Lighting/Ventilation units/year for camera PATS and 50 units/year for drone PATS Institution of a Supplier Code of Conduct and Compliance Monitoring of Suppliers Yes Involves a dedicated effort to promote fair employment practices and safe working conditions at supplier factories (regarding excessive work hours, substandard wages, underage labor, exposure to toxic materials, and unsafe work practices). Entails added annual administrative costs of $500k. 70 Cash Outlays for Corporate Social Responsibility and Citizenship in Year 8 Total Cash Outlays $8,016 $ Per unit Sold $7.01 (5000s) Y3 Y4 Y5 0 No The information below indicates the range of effort being exerted by companies to operate in a socially responsible manner and be good corporate citizens. These statistics should be helpful in crafing your own company's social responsibility strategy. Company CSRC Efforts Charitable Contributions (5000s) "Green" Initiatives Renewable Energy Program (5000s) Improved Working Facilities Conditions Safety/Lighting Supplier Code of Conduct Total Cash Thousands of $ Outlays $ Per Unit Sold 02222 0 No No Y6 1,000 Yes 0 No No No 5,713 4.61 Y7 1,000 Yes 1,000 Yes Yes No 12,776 11.45 Year 7 19,240 6,072 No No No 0 0.00 No 0 0.00 Industry 1 CSRC Cash Outlays Year 6 Thousands of $ High 15,442 Average 5,797 Low 0 $ Per Unit Sold High Average 5.86 LOW 0.00 18.21 0 0.00 16.90 0.00 5.56 A Company - Year 8 Help Print Save Deci: Decisions / Reports Menu AC CAMERA WORKFORCE COMPENSATION UAV DRONE WORKFORCE COMPENSATION DECISION ENTRIES - YEAR 8 Product Design AC Camera Marketing UAV Drone Marketing Compensation & Facilities Special Contract Offers Corporate Citizenship Finance & Cash Flow Compensation Decisions Company Ind. Avg. (Year 8) (last year) Base Wage per PAT member) +1% - change $21,018 $21,015 Assembly Quality Incentive $ 2.70 - per unit 2,162 2,071 Attendance Bonus $ 900 - per worker 900 885 Fringe Benefit Package $2600 per worker 2,600 2,140 Total Compensation (5 per worker per year) $26,680 $26, 110 Best Practices / Productivity Improvement Training (SPAT $ 1250 Projected PAT Productivity (AC Camera units per PAT per year) 3,214 AC CAMERA ASSEMBLY FACILITY Compensation Decisions Company Ind. Avg. (Year 8) (last year) Base Wage (per PAT member) +2% change $21,226 $21,081 Assembly Quality Incentive $ 5.20 - per unit 2,079 2,020 Attendance Bonus $ 1000 - perworker 1,000 945 Fringe Benefit Package $2600 per worker 2,600 2,600 Total Compensation (Sper worker per year) $26,905 $26,646 Best Practices / Productivity Improvement Training (SPAT) $ 1250 Projected PAT Productivity (UAV Drone units per PAT per year) 1,616 UAV DRONE ASSEMBLY FACILITY CAMERA & DRONE JOURNAL Projected Y8 Performance Investor Scoring Measures Year 8 Expect Earings Per Share $2.15 $3.00 Return On Equity 20.3% 25.0% Credit Rating Image Rating Change Other Measures Year 8 from Y7 Net Revenues (50008) 467,104 +8.4% Net Profit (5000) 43,028 -16.4 Ending Cash (5000) 33,304 +28,383 Workstation Spaces Installed Workstations At the End of Year 7 420 spaces At the End of Year 7 409 worksins Expansion (new spaces) 0 - 400kea Installed for Y8 0 5125kea Available for Year 8 420 spaces Available for Year 8 409 worksns Additional Workstations Needed to Avoid Overtime Assembly 0 Assembly Capability (000s of units) 1,315.0 wo OT 1,578.0 at maximum OT Projected Camera Demand (000s of units) 990.0 Expected ACC Unit Shortfall (unsatisfied demand) 0.0 (000s of units) Workstation Spaces Installed Workstations At the End of Year 7 130 spaces At the End of Year 7 118 worksins Expansion (new spaces) 0 - 400k en Installed for Y8 0 5175kea Available for Year 8 130 spaces Available for Year 8 118 worksins Additional Workstations Needed to Avoid Overtime Assembly 0 Assembly Capability (000s of units) 191.0 wo OT 229.0 at maximum OT Projected Drone Demand (000s of units) 152.7 Expected UAV Unit Shortfall (unsatisfied demand) 0.0 (000s of units) . 000 Unit Assembly and Labor Costs ACC Assembly Regular-Time Overtime Training Total Units 0008 152.7 000) 990.0 0.0 Labor Costs $000 $/unit 32,977 33.31 0 0.00 386 0.39 33,363 33.70 Unit Assembly and Labor Costs UAV Assembly Regular-Time Overtime Training Total 0.0 Labor Costs $000s S/unit 9,729 63.71 0 0.00 119 0.78 9,848 64.49 990.0 152.7 Robotics Upgrade for All ACC Workstations No Upgrade (to reduce the number of persons per PAT from 4 to 3) $000s Cost Impact of Depreciation (5% of Sok capital cost of upgrade) Upgrade Labor (total savings in wages and incentive pay) (5000s) Maintenance (addonal cost of $9.0k per workstation) Interest (if financed 100% with a 10-Year Loan Net Annual Cost Impact of Robotics Upgrade Robotics Upgrade for All UAV Workstations No Upgrade (to reduce the number of persons per PAT from 4 to 3) $000s Cost Impact of Depreciation (5% of Sok capital cost of upgrade) Upgrade Labor total savings in wages and incentive pay) (5000s) Maintenance (additional cost of $9.Ok per workstation) Interest (if financed with a stock issue ) Net Annual Cost Impact of Robotics Upgrade A Company Year 8 Help Print Save Decisi Decisions / Reports Menu Sources of - Additional Cash (5000s) DECISION ENTRIES YEAR 8 Product Design AC Camera Marketing UAV Drone Marketing Compensation & Facilities Special Contract Offers Corporate Citizenship Finance & Cash Flow FINANCE AND CASH FLOW - 1-Year Bank Loan (460% Interest) 0 Uses for 5-Year Bank Loan (5.10% interest) Excess Cash 10-Year Bank Loan (5.60% interest) 0 (5000s) Stock Issue (000s of shares at $75.66) 0 Maximum share issue in Y8 = 5000k 0 Early Repayment of L-TO None Loans Balance Sheet Note 8) N/A - Dividend (S/share) Year 7 dividend was $0.00 Stock Repurchase (000s of shares at $75.66) Maximum share repurchase in Y8 = 750k 0 Shares of stock outstanding at the beginning of Year 8 20,000 Shares of stock outstanding at the end of Year 8 20,000 k CAMERA & DRONE JOURNAL Projected Y8 Performance 6 Investor Scoring Measures Year 8 Expect. Earnings Per Share $2.15 $3.00 Retum On Equity 20.3% 25.0% Credit Rating A- Image Rating 76 Change Other Measures Year 8 from Y7 Net Revenues (5000s) 467,104 +8.4% Net Profit (50008) 43,028 -16.4 Ending Cash (8000) 33,304 +28,383 Projected Cash Available in Year 8 Beginning Cash Balance (carried over from Year 7) Cash Inflows Receipts from Sales Bank Loans 1-Year 5-Year 10-Year Stock Issue (0 shares @575.66) Loan to Cover Overdraft (1-year loan) Interest on Year 7 Cash Balance Cash Refund (awarded by instructor) Cash Available from All Sources T2 Projected Cash Outlays in Year 8 $ 4,921 Cash Outlays Payments to Component Suppliers $ 179,022 466,012 Production and Assembly Expenses 117,073 Delivery/Marketing/Admin Expenses 76,378 Capital - New Workstations Outlays Robotics Upgrade Facilities Expansion Facilities Improvement 1,000 Loan Principal 1-Year Loans 20,000 Repayment 5-Year Loans 10-Year Loans 16,000 $ 470,987 Interest Payments Bank Loans 8,770 Y7 Overdraft Stock Repurchases (0 shares @ $75.66) 0 Income Tax Payments 18,440 Dividend Payments Charitable Contributions 1,000 Cash Fine (assessed by Instructor) Total Cash Outlays $ 437,683 $ +33,304 Could generate interest income of $366k in Year 9. 1 OOO Projected Cash Balance at the End of Year 8 (5000s) Other Important Financial Statistics Interest Rate Paid on Overdraft Loans Interest Rate Received on Cash Balances Shareholder Equity (mandated minimum = $100 mil.) Last Year 7.1% 1.1% 190.2 mil Year 8 (projected) 6.6% 1.1% 233.2 mil. Performance on Credit Rating Measures Debt / Equity Percentage (DE) Interest Coverage Ratio (operating profit + interest exp.) Current Ratio (current assets current liabilities) Last Year 45:55 8.21 1.18 Year 8 projected) 36:64 8.17 1.84 22 Earnings Per Share ($) Earnings Per Share scores are based on a 20% or 20 point weighting. Bolded numbers indicate achievement of the investor expected EPS shown below each yearly column head. Highlighted numbers indicate best-in-industry performances for each year. Game-To-Date based on a weighted average of the annual EPS performances. For more information, click the Help button (above-right). Y6 Y7 Y8 Y 9Y10Y11 Y12 Y13 Y14 Y15 Wgt. Avg. Y7 Score G-T-D Score (1.25) (2.00) (3.00) (4.25) (5.50) (7.00) (8.50) (10.50) (12.50) (14.50) (1.63) I.E. B-I-I I.E. B-I-I 1.21 2.57 1.89 23 0.79 2.22 1.51 2.07 3.07 2.25 4.18 3.22 2.76 4.43 3.59 1.63 1.68 1.66 2.06 2.91 2.48 1.28 4.00 2.64 3.12 5.32 4.21 1.13 1.84 1.48 4.04 aan Return On Equity (%) 13 Return On Equity scores are based on a 20% or 20 point weighting. Bolded numbers indicate achievement of the investor expected ROE shown below each yearly column head. Highlighted numbers indicate best-in-industry performances for each year. Game-To-Date scores are based on a weighted average of the annual ROE performances. For more information, click the Help button (above-right). Y6 Y7 Y8 Y9 Y 10 Y11Y12 13 14 15 Wgt. Avg. Y7 Score G-T-D Score (17.5) (20.0) (25.0) (30.0) (35.0) (40.0) (42.5) (45.0) (47.5) (50.0) (18.8) I.E. B-I-I I.E. B-I-I 19.1 31.3 26.0 24 24 11 13.0 29.1 21.9 24 12 22 30.6 38.9 35.7 32.9 41.5 38.0 24 16 38.8 41.4 40.4 25.0 20.5 22.5 30.5 31.4 31.1 24 13 20.1 34.4 42.9 49.9 47.0 24 20 18.0 23.7 21.1 22 9 15 MOO UWLUIH 44.4 Stock Price ($ per share) A B Stock Price scores are based on a 20% or 20 point weighting. Bold numbers indicate achievement of the investor expected stock price shown below each yearly column head. Highlighted numbers indicate best-in-industry performance for each year. Game-To-Date scores are based solely on the most recent year's stock price. For more information, click the Help button (above-right). Y6 Y7 Y8Y9Y10 11 12 13 14 15 Y7 Score G-T-D Score (20.00) (35.00) (60.00) (100.00) (150.00) (200.00) (250.00) (300.00) (330.00) (350.00) I.E. B-I-I I.E. B-I-I 27.06 75.66 24 9 8.74 64.50 24 7 24 7 64.01 132.36 70.03 137.29 91.06 146.09 - 17 24 17 43.75 38.84 63.15 87.03 32.64 128.23 102.61 175.00 22.42 46.74 24 15 HITMOOD G Credit Rating Credit Rating scores are based on a 20% or 20 point weighting. Bolded credit ratings indicate achieving or exceeding the investor expected EPS shown below each yearly column head. For Best-In-Industry scoring, an A+ credit rating earns a score of 100 points (lesser credit ratings earn lower scores). Game-To-Date scores are based solely on the most recent year's credit rating. Y6 Y7Y8Y9Y10Y11 Y12 Y13 Y14 Y15 Y7 Score G-T-D Score (B+) (B+) (A-) (A-) (A-) (A) (A) (A) (A) (A) I.E. B-I-I I.E. B-I-I 22 18 16 2016 23 1923 19 23 19 23 19 18 22 UHITIMOOOD Image Rating Image Rating scores are based on a 20% or 20 point v indicate achieving or exceeding the investor expected image rating shown below each yearly column head. Highlighted numbers indicate best-in-industry performances for each year. Game-To- Date scores are based on an average of each company's image ratings for the most recent three years. Y6 Y7 Y8 Y9Y10 Y11 Y12 Y 13 Y14Y15 Y5-Y7 Y7 Score G-T-D Score (70) (72) (72) (75) (75) (77) (77) (80) (80) (80) Average I.E. B-I-I I.E. B-I-I 77 73 2018 2118 70 21 18 19 19 A 79 21 19 UHITIMO 21 18 Corporate Social Responsibility and Citizenship Industry 1 Cash Outlays for Corporate Image Rating Points Social Responsibility and Citizenship Generated from Total Dollars (5000s) Per Unit Sold (S/unit) CSRC Expenditures High Average Low High Average Low High Average Low 15,442 5,797 0 18.21 5.86 0.00 6 3 0 19,240 6,0720 16.90 5.56 0.009 4 0 Corporate Responsibility Award for Exemplary Corporate Citizenship Beginning in Year 9, the World Council for Exemplary Corporate Citizenship presents a distinguished award to the company making the highest cash outlays as a percentage of revenues for corporate social respon- sibility and citizenship initiatives. Award Winner 2nd Place Year 6 Year 7 Year 8 Year 9 Year 10 Year 11 Year 12 Year 13 Year 14 Year 15 Y9 Y10 Y11 Y12 Y13 Y14 Y15 Year 7 Scoreboard Journal 24-Feb-20 Investor Best-In- Weighted Expectation Industry Average Score Score Score Change from Y6 Rank Company Name Industry 1 117 +1 BUSN 440 SP 2020 116 116 108 103 101 100 +18 100 +5 Year 7 I-SAKE E Company Halcyon C-Power Electronics D-DALM Action Pro G Company A Company B PerfectShot J Company F Company COVOAAWN 116 114 114 113 110 +10 105 99 Game-To-Date Scoreboard Investor Best-In- Weighted Expectation Industry Average Score Score Score Overall G-T-D Score Bonus Points Rank 117 116 108 103 116 101 108 103 100 100 98 101 voowwN- Company Name I-SAKE E Company C-Power Electronics Halcyon D-DALM Action Pro G Company A Company B PerfectShot J Company F Company 117 114 113 113 106 105 103 91 89 79 O A Company Year 8 Help Print Save Decisio Decisions / Reports Menu DECISION ENTRIES YEAR 8 Product Design AC Camera Marketing UAV Drone Marketing Compensation & Facilities Special Contract Offers Corporate Citizenship Finance & Cash Flow ACTION-CAPTURE CAMERA DESIGN Image Sensor Size 12mm diagonal LCD Display Screen 920k - povels Image Quality (maximum resolution) 2704x2028 pix Number of Photo Modes (video/sil) 8/3 - modes Product Camera Housing S 9 - per camera Enhancements Edition/Sharina Canabilities Editing/Sharing Capabilities S $ 9- . per camera Included Accessories $ 11 per camera Extra Performance Features 3- features Number of AC Camera Models 3- models Product R&D Expenditures (Y7 was $20,000) $ 20000 5000s) Cumulative R&D Expenditures (all years) $ 105,000 (5000s) Performance / Quality Rating (PO Rating ranges from 1-10 stars) 4.5 * UAV DRONE DESIGN Built-In Camera Company's Best Model + Significant Upgrade - GPS / WiFi / Bluetooth Advanced Battery Pack (maximum flight time) 15 minutes Number of Rotors 6 ) rotors Rotor Performance / Flight Controller Enhanced - Body Frame Construction Carbon Fiber Obstacle Sensors 360 Enhanced - Camera Stabilization Device Advanced- Extra Performance Features 6 ) features Number of UAV Drone Models 3 models Product R&D Expenditures (Y7 was $15.000) $ 18000 (5000s) Cumulative R&D Expenditures (all years) $ 78,000 (5000s) CAMERA & DRONE JOURNAL Projected Y8 Performance Performance / Quality Rating (P/Q Rating ranges from 1-10 stars) 4.8 * Scoring Measures Eamings Per Share Return On Equity Credit Rating Image Rating Year 8 $2.15 20.3% S/unit Investor Expect. $3.00 25.0% A- 72 Change from Y7 +8.4% -164 +28,383 Year Other Measures Net Revenues (50008) Net Profit (S0005) Ending Cash (5000) 467,104 43,028 33,304 Projected AC Camera Production Costs Image Sensor LCD Display Screen Image Quality Photo Modes Camera Housing Editing/ Sharing Capabilities Included Accessories Extra Performance Features Total Cost of Components and Features Assembly Labor Costs Product R&D Expenditures Allowance for Warranty Repairs Maintenance of plant and Equipment Depreciation of Plant and Equipment Total Camera Production/Assembly Cost Regular AC Camera Unit Assembly (000) 990.0 $000s 14,256 9,504 7,603 8,554 8,910 8,910 10,890 8,211 76,838 33,363 20.000 3,870 16,618 10,894 161,583 Projected UAV Drone Production Costs Built-In Camera GPS / WiFi / Bluetooth Battery Pack Rotors / Performance / Controller Body Frame Construction Obstacle Sensors Camera Stabilization Device Extra Performance Features Total Cost of Components and Features Assembly Labor Costs Product R&D Expenditures Allowance for Warranty Repairs Maintenance of Plant and Equipment Depreciation of Plant and Equipment Total Drone Production/Assembly Cost 14.40 9.60 7.68 8.64 9.00 9.00 11.00 8.29 77.61 33.70 20.20 3.91 16.79 11.00 163.22 1 000 $000 $/unit 31,575 206.78 11,338 74.25 15, 117 99.00 6,047 39.60 6.802 44.55 13,908 91.08 5,745 37.62 18,408 120.55 108,941 713.43 9,848 64.49 18,000 117.88 4,620 30.26 10,754 70.43 5,795 37.95 157,958 1,034.43 ta ! Overtime 0.0 Total 990.0 UAV Drone Unit Assembly (000) Regular 152.7 Overtime 0. 0 Total 1 52.7 A Company Year 8 Help Print Save Dec Decisions / Reports Menu DECISION ENTRIES - YEAR 8 Product Design AC Camera Marketing UAV Drone Marketing Compensation & Facilities Special Contract Offers Corporate Citizenship Finance & Cash Flow ACTION-CAPTURE CAMERA MARKETING Average Wholesale Price to Retailers (S/unit) Buyer Appeal Variables Generated P/Q Rating from Product Design Decisions No. of Models Retailer Support Budget (5000s) Projected Support Expenditures Per Unit Sold Advertising Budget (5000s) Website Displays/Info (5000s) Sales Promotions (number of weeks % discount) Warranty Period (60 days. 90 days, 120 days, 180 days, 1 year) Expected Claim Rate(%) Repair Cost (5000s) North America $ 250 4.5 3 models $ 1730 $5.49 per unit $ 3000 $ 2000 1 wk - 15% 90 days 10 2% $1.605 Year 7 Year 8 Actual Projected 324.2 315.1 11.4% 10.6% Year 7 Year 8 47 38 95 75 3,880 3,120 Europe-Africa $ 246 4.5+ 3 models $ 1450 $5.27 per unit $ 2000 $ 1400 2 wks - 10% 60 days ) 67% 925 Year 7 Years Actual Projected 275.0 274.9 10.5% 10.1% Year 7 Year 8 Asia-Pacific $ 242 4.5+ 3 models $ 1130 $4.53 per unit $ 1500 $ 1200 2 wks - 10%- 60 days - 67% $835 Year 7 Year 8 Actual Projected 244.7 249.2 11.1% 10.4% Year 7 Year 8 32 66 60 2,711 2,600 Latin America $ 245 4.5 3 models $ 800 $5.31 per unit $ 850 $ 850 | 2 wks - 10% - 60 days 67% $505 Year 7 Year 8 Actual Projected 153.9 150.8 9.6% 8.6% Year 7 Year 8 25 20 53 39 1,757 1,366 CAMERA & DRONE JOURNAL Market Segment Statistics AC Camera Demand- and Market Share Unit Demand (000s) Market Share (%) Projected Y8 Performance i Investor Scoring Measures Year 8 Expect. Earnings Per Share $2.15 $3.00 Retum On Equity 20.3% 25.0% Credit Rating A- Image Rating 72 Change Other Measures Year 8 from Y7 Net Revenues (50008) 467,104 +8.4% Net Profit (S0005) 43,028 -16.4 Ending Cash (5000s) 33,304 +28,383 39 Retail Outlets (number willing to cary the company's product line) Multi-Store Chains Online Retailers Local Retail Shops 80 3,315 69 2,950 DO Price-Cost-Profit Breakdown (per unit sold) Revenue - Wholesale Price Projections - Promotional Discounts + Exchange Rate Adjustment Net Revenues Operating Cost - Cost of Units Assembled Projections Delivery Costshipping/import duties) Marketing Costs Administrative Expenses Total Operating costs Operating Profit Operating Profit Margin (operating profit + net revenues) $ Per Unit 250.00 -0.72 - 14.97 234.31 164.40 6.00 21.36 8.90 200.66 33.65 $ Per Unit 246.00 -0.95 -15.97 229.09 162.67 15.84 17.64 8.90 205.05 24.03 10.5% $ Per Unit 242.00 -0.93 -7.81 233.26 162.66 20.52 15.37 8.90 207.44 25.81 11.1% $ Per Unit 245.00 -0.94 11.10 255.16 162.65 20.70 16.58 8.90 208.83 46.33 18.2% 14.4% Europe-Africa $ 312 per unit 49 Competitive Assumptions Anticipated Industry Price to Retailers Average Marketing P/Q Rating Efforts in Year 8 Number of Models Retailer Support Advertising Budget Website Displays Sales Promotions Warranty Period North America $ 335 per unit 4.9 3.2 models $ 10.90 per unit $ 4,050 (5000s) $ 2,370 (5000s) 3 wks - 14.7% ( 200 days 3.2 models $ 10.20 per unit $ 2,995. (5000s) $ 2,040 (5000s) 3 wks 14.7% (160 days Asia-Pacific $ 295 per unit 4.9 3.2. models $ 10.70 per unit $ 2,150 (5000s) $ 1,170 (5000s) 3 wks 13.2% 150 days Latin America $ 283 per unit 4.9 3.2 models $ 11.80 per unit $ 1,940 (5000s) $ (1,145 (5000s) 4 wks - I 12.7% 120 days A Company - Year 8 Help Print Save Decisi Decisions / Reports Menu UAV DRONE MARKETING DECISION ENTRIES YEAR 8 Product Design AC Camera Marketing UAV Drone Marketing Compensation & Facilities Special Contract Offers Corporate Citizenship Finance & Cash Flow Average Retail Price (Slunit to direct online customers) Discount Offered to 3rd-Party Online Retailers Buyer Appeal Variables Generated P/Q Rating from Product Design Decisions No. of Models Website Product Displays / Info (5000s) Search Engine Advertising (5000s) Retailer Recruitment / Support Budget (5000s) Retailer Recruitment / Support (per 3rd party unit sold) Warranty Period (60 days. 90 days, 120 days, 180 days, 1 year) Expected Claim Rate (%) Repair Cost (5000) North America $ 1800 10%- 4.87 3 models $ 3000 $ 3000 $ 1300 $123.81 per unit 90 days 11.2% $1.650.0 Europe-Africa $ 1722 15% - 4.8 3 models $ 2000 $ 1700 $ 1000 $75.19 per unit 60 days ) 72% S901.0 Year 7 Year 8 Actual Projected 20.2 28.9 7.5 13.3 27.7 42.2 6.0% 8.3% Year 7 Year 8 33 26 Asia-Pacific $ 1500 10%- 4.87 3 models $ 1100 $ 1200 $ 700 $82.35 per unit 90 days 11.2% $1.200.0 J Year 7 Year 8 Actual Projected 19.1 27.1 3.4 8.5 22.5 35.6 7.3% 9.9% Year 7 Year 8 Latin America $ 1415 10%- 4.8 3 models $ 1200 $ 900 $ 600 $100.00 per unit 90 days - 11.2% 870.0 Year 7 Year 8 Actual Projected 13.9 20.0 3.1 6.0 17.0 26.0 8.1% 10.8% Year 7 Year 8 19 16 CAMERA & DRONE JOURNAL Market Segment Statistics UAV Drone Demand - Direct (thru company website) and Market Share 3rd-Party (thru online retailers) Total Unit Demand (000s) Market Share (%) Projected Y8 Performance 0 Investor Scoring Measures Year 8 Expect. Earnings Per Share $2.15 $3.00 Retum On Equity 20.3% 25.0% Credit Rating AA- Image Rating 76 72 Change Other Measures Year 8 from Y7 Net Revenues (S000S) 467,104 +8.4% Net Profit (5000s) 43,028 -16.4 Ending Cash (5000s) 33,304 +28,383 Year 7 Year 8 Actual Projected 41.7 38.4 8.0 10.5 49.7 48.9 9.6% 8.4% Year 7 Year 8 42 33 Online Retailers (willing to carry the company's product line) 27 22 Price-Cost-Profit Breakdown ($ per unit sold) 31 Revenue -Selling Price Projections + Exchange Rate Adjustment Net Revenues Operating Cost Cost of Units Assembled Projections Delivery Cost (shipping / Import duties) Marketing Costs Administrative Expenses Total Operating costs Operating Profit Operating Profit Margin (operating profit + net revenues) Online Online Sales Retailers 1,800.00 1,620.00 -108.10 -97.33 1,691.90 1,522.67 1,037.81 1,038.29 62.50 12.48 156.25 123.81 11.74 11.81 1,268.31 1,186.38 423.59 336.29 25.0% 22.1% 24.5% Direct 3rd-Party Online Online Sales Retailers 1,722.00 1,463.68 - 112.18 -95.34 1,609.82 1,368.35 1,025.64 1,025.34 131.38 71.05 128.03 75.19 11.76 11.73 1,296.82 1,183.31 313.00 185.04 19.4% 13.5% 17.8% Direct3rd-Party Online Online Sales Retailers 1,500.00 1,350.00 -48.60 43.76 1,451.40 1,306 24 1,037.34 1,039.53 152.51 93.53 84.87 82.35 11.73 11.76 1,286.46 1,227.18 164.94 79.06 11.4% 6.1% 10.2% Direct 3rd-Party Online Online Sales Retailers 1,415.00 1,273,50 64.35 58.00 1,479.35 1,331,50 1,038.05 1,036.67 147.40 88.83 105.00 100.00 11.75 11.67 1,302.20 1,237.17 177.15 94.33 12.0% 7.1% 10.9% Competitive Assumptions Anticipated Industry - Average Retail Price Average Marketing Retailer Discount Efforts in Year 8 P/Q Rating Number of Models Website Displays Search Engine Advertising Retailer Recruitment Warranty Period North America $ 1,885 per unit 15.0 % 5.1 . * 2.2 A models $ 2,960 (5000s) $ 3,730 (5000s) $ 192.10 per unit 170 days Europe Africa $ 1,792 per unit | 14.9 % 5.1 . (2.2 models $ 2,685 ($000s) $ 3,140 - (5000s) $ 162.20 per unit 170 . days Asia-Pacific $ 1,655 per unit 13.0 % (5.1 . 2.2 A models $ 1,923 (5000s) $ 1,710 (5000s) $ 198.20 per unit 130 days Latin America $ 1,525 per unit 13.9 % 5.1 2.2 . models $ 1,125 (5000s) $ 950 (5000s) $ 166.50 per unit 130 days A Company Year 8 Help Print Save Decis Decisions / Reports Menu DECISION ENTRIES YEAR 8 Product Design AC Camera Marketing UAV Drone Marketing Compensation & Facilities Special Contract Offers Corporate Citizenship Finance & Cash Flow Corporate Social Responsibility and Citizenship Below are six CSRC initiatives that can be used to develop a "social However, which (if any) of the six initiatives to pursue and how much responsibility strategy" for your company. The drop-down selection to spend is entirely voluntary. There is no pressure to spend anything boxes below offer several optional actions. on these initiatives the company can perform success-fully without While practicing good corporate citizenship is often considered "the undertaking any social responsibility initiatives. In Year 5, prior company management spent no money on any of the six optional right thing to do", one reason to operate in a socially responsible manner is to enhance the company's image. Aggressive and astute social responsibility initiatives. pursuit of a social responsibility strategy over 5 years can increase The Help button at the top-right offers further information and the company's Image Rating by 15 to 20 points. guidance regarding the six CSRC initiatives. CSRC INITIATIVES CAMERA & DRONE JOURNAL Projected Y8 Performance 6 Investor Scoring Measures Year 8 Expect. Earnings Per Share $2.15 $3.00 Return On Equity 20.3% 25.0% Credit Rating A- Image Rating 76 72 Change Other Measures Year 8 from Y7 Net Revenues (50008) 467,104 +8.4% Net Profit (5000) 43,028 -164 Ending Cash (5000s) 33,304 +28,383 Involves donations to registered charities and charitable causes. Treated Charitable Contributions $[ 1000 or 0.0% of operating profit on the Income Statement as "Other Expenses" (reduces pre-tax income). "Green" Initiatives to promote Involves use of environmentally friendly components, recycled materials, and green shipping. Increases (Yes production cost of AC Cameras by $2.00 and UAV Drones by $5.00 per unit, shipping costs of AC Environmental Sustainability Cameras by $1.00 and UAV Drones by $2.50 per unit, and annual administrative costs by $300k Renewable Energy Program $ 1000 involves ongoing expenditures to incorpoprate renewable energy resources at the Taiwan assembly facilities. These expenditures are treated as capital investment and depreciated at 5% per year. Involves one-time capital investment of $2.5 million and increased administrative Cafeteria and On-Site Child Care Continue c osts of SBOOK annually Results in one-time productivity increases of 100 Improved Facilities for Plant Employees units/year for camera PATS and 50 units/year for drone PATS. Working Conditions Involves one-time capital investment of $3.0 million and increased administrative Additional Safety Equipment and continue costs of $500k annually Results in one-time productivity increases of 100 Improved Lighting/Ventilation units/year for camera PATS and 50 units/year for drone PATS Institution of a Supplier Code of Conduct and Compliance Monitoring of Suppliers Yes Involves a dedicated effort to promote fair employment practices and safe working conditions at supplier factories (regarding excessive work hours, substandard wages, underage labor, exposure to toxic materials, and unsafe work practices). Entails added annual administrative costs of $500k. 70 Cash Outlays for Corporate Social Responsibility and Citizenship in Year 8 Total Cash Outlays $8,016 $ Per unit Sold $7.01 (5000s) Y3 Y4 Y5 0 No The information below indicates the range of effort being exerted by companies to operate in a socially responsible manner and be good corporate citizens. These statistics should be helpful in crafing your own company's social responsibility strategy. Company CSRC Efforts Charitable Contributions (5000s) "Green" Initiatives Renewable Energy Program (5000s) Improved Working Facilities Conditions Safety/Lighting Supplier Code of Conduct Total Cash Thousands of $ Outlays $ Per Unit Sold 02222 0 No No Y6 1,000 Yes 0 No No No 5,713 4.61 Y7 1,000 Yes 1,000 Yes Yes No 12,776 11.45 Year 7 19,240 6,072 No No No 0 0.00 No 0 0.00 Industry 1 CSRC Cash Outlays Year 6 Thousands of $ High 15,442 Average 5,797 Low 0 $ Per Unit Sold High Average 5.86 LOW 0.00 18.21 0 0.00 16.90 0.00 5.56 A Company - Year 8 Help Print Save Deci: Decisions / Reports Menu AC CAMERA WORKFORCE COMPENSATION UAV DRONE WORKFORCE COMPENSATION DECISION ENTRIES - YEAR 8 Product Design AC Camera Marketing UAV Drone Marketing Compensation & Facilities Special Contract Offers Corporate Citizenship Finance & Cash Flow Compensation Decisions Company Ind. Avg. (Year 8) (last year) Base Wage per PAT member) +1% - change $21,018 $21,015 Assembly Quality Incentive $ 2.70 - per unit 2,162 2,071 Attendance Bonus $ 900 - per worker 900 885 Fringe Benefit Package $2600 per worker 2,600 2,140 Total Compensation (5 per worker per year) $26,680 $26, 110 Best Practices / Productivity Improvement Training (SPAT $ 1250 Projected PAT Productivity (AC Camera units per PAT per year) 3,214 AC CAMERA ASSEMBLY FACILITY Compensation Decisions Company Ind. Avg. (Year 8) (last year) Base Wage (per PAT member) +2% change $21,226 $21,081 Assembly Quality Incentive $ 5.20 - per unit 2,079 2,020 Attendance Bonus $ 1000 - perworker 1,000 945 Fringe Benefit Package $2600 per worker 2,600 2,600 Total Compensation (Sper worker per year) $26,905 $26,646 Best Practices / Productivity Improvement Training (SPAT) $ 1250 Projected PAT Productivity (UAV Drone units per PAT per year) 1,616 UAV DRONE ASSEMBLY FACILITY CAMERA & DRONE JOURNAL Projected Y8 Performance Investor Scoring Measures Year 8 Expect Earings Per Share $2.15 $3.00 Return On Equity 20.3% 25.0% Credit Rating Image Rating Change Other Measures Year 8 from Y7 Net Revenues (50008) 467,104 +8.4% Net Profit (5000) 43,028 -16.4 Ending Cash (5000) 33,304 +28,383 Workstation Spaces Installed Workstations At the End of Year 7 420 spaces At the End of Year 7 409 worksins Expansion (new spaces) 0 - 400kea Installed for Y8 0 5125kea Available for Year 8 420 spaces Available for Year 8 409 worksns Additional Workstations Needed to Avoid Overtime Assembly 0 Assembly Capability (000s of units) 1,315.0 wo OT 1,578.0 at maximum OT Projected Camera Demand (000s of units) 990.0 Expected ACC Unit Shortfall (unsatisfied demand) 0.0 (000s of units) Workstation Spaces Installed Workstations At the End of Year 7 130 spaces At the End of Year 7 118 worksins Expansion (new spaces) 0 - 400k en Installed for Y8 0 5175kea Available for Year 8 130 spaces Available for Year 8 118 worksins Additional Workstations Needed to Avoid Overtime Assembly 0 Assembly Capability (000s of units) 191.0 wo OT 229.0 at maximum OT Projected Drone Demand (000s of units) 152.7 Expected UAV Unit Shortfall (unsatisfied demand) 0.0 (000s of units) . 000 Unit Assembly and Labor Costs ACC Assembly Regular-Time Overtime Training Total Units 0008 152.7 000) 990.0 0.0 Labor Costs $000 $/unit 32,977 33.31 0 0.00 386 0.39 33,363 33.70 Unit Assembly and Labor Costs UAV Assembly Regular-Time Overtime Training Total 0.0 Labor Costs $000s S/unit 9,729 63.71 0 0.00 119 0.78 9,848 64.49 990.0 152.7 Robotics Upgrade for All ACC Workstations No Upgrade (to reduce the number of persons per PAT from 4 to 3) $000s Cost Impact of Depreciation (5% of Sok capital cost of upgrade) Upgrade Labor (total savings in wages and incentive pay) (5000s) Maintenance (addonal cost of $9.0k per workstation) Interest (if financed 100% with a 10-Year Loan Net Annual Cost Impact of Robotics Upgrade Robotics Upgrade for All UAV Workstations No Upgrade (to reduce the number of persons per PAT from 4 to 3) $000s Cost Impact of Depreciation (5% of Sok capital cost of upgrade) Upgrade Labor total savings in wages and incentive pay) (5000s) Maintenance (additional cost of $9.Ok per workstation) Interest (if financed with a stock issue ) Net Annual Cost Impact of Robotics Upgrade A Company Year 8 Help Print Save Decisi Decisions / Reports Menu Sources of - Additional Cash (5000s) DECISION ENTRIES YEAR 8 Product Design AC Camera Marketing UAV Drone Marketing Compensation & Facilities Special Contract Offers Corporate Citizenship Finance & Cash Flow FINANCE AND CASH FLOW - 1-Year Bank Loan (460% Interest) 0 Uses for 5-Year Bank Loan (5.10% interest) Excess Cash 10-Year Bank Loan (5.60% interest) 0 (5000s) Stock Issue (000s of shares at $75.66) 0 Maximum share issue in Y8 = 5000k 0 Early Repayment of L-TO None Loans Balance Sheet Note 8) N/A - Dividend (S/share) Year 7 dividend was $0.00 Stock Repurchase (000s of shares at $75.66) Maximum share repurchase in Y8 = 750k 0 Shares of stock outstanding at the beginning of Year 8 20,000 Shares of stock outstanding at the end of Year 8 20,000 k CAMERA & DRONE JOURNAL Projected Y8 Performance 6 Investor Scoring Measures Year 8 Expect. Earnings Per Share $2.15 $3.00 Retum On Equity 20.3% 25.0% Credit Rating A- Image Rating 76 Change Other Measures Year 8 from Y7 Net Revenues (5000s) 467,104 +8.4% Net Profit (50008) 43,028 -16.4 Ending Cash (8000) 33,304 +28,383 Projected Cash Available in Year 8 Beginning Cash Balance (carried over from Year 7) Cash Inflows Receipts from Sales Bank Loans 1-Year 5-Year 10-Year Stock Issue (0 shares @575.66) Loan to Cover Overdraft (1-year loan) Interest on Year 7 Cash Balance Cash Refund (awarded by instructor) Cash Available from All Sources T2 Projected Cash Outlays in Year 8 $ 4,921 Cash Outlays Payments to Component Suppliers $ 179,022 466,012 Production and Assembly Expenses 117,073 Delivery/Marketing/Admin Expenses 76,378 Capital - New Workstations Outlays Robotics Upgrade Facilities Expansion Facilities Improvement 1,000 Loan Principal 1-Year Loans 20,000 Repayment 5-Year Loans 10-Year Loans 16,000 $ 470,987 Interest Payments Bank Loans 8,770 Y7 Overdraft Stock Repurchases (0 shares @ $75.66) 0 Income Tax Payments 18,440 Dividend Payments Charitable Contributions 1,000 Cash Fine (assessed by Instructor) Total Cash Outlays $ 437,683 $ +33,304 Could generate interest income of $366k in Year 9. 1 OOO Projected Cash Balance at the End of Year 8 (5000s) Other Important Financial Statistics Interest Rate Paid on Overdraft Loans Interest Rate Received on Cash Balances Shareholder Equity (mandated minimum = $100 mil.) Last Year 7.1% 1.1% 190.2 mil Year 8 (projected) 6.6% 1.1% 233.2 mil. Performance on Credit Rating Measures Debt / Equity Percentage (DE) Interest Coverage Ratio (operating profit + interest exp.) Current Ratio (current assets current liabilities) Last Year 45:55 8.21 1.18 Year 8 projected) 36:64 8.17 1.84 22 Earnings Per Share ($) Earnings Per Share scores are based on a 20% or 20 point weighting. Bolded numbers indicate achievement of the investor expected EPS shown below each yearly column head. Highlighted numbers indicate best-in-industry performances for each year. Game-To-Date based on a weighted average of the annual EPS performances. For more information, click the Help button (above-right). Y6 Y7 Y8 Y 9Y10Y11 Y12 Y13 Y14 Y15 Wgt. Avg. Y7 Score G-T-D Score (1.25) (2.00) (3.00) (4.25) (5.50) (7.00) (8.50) (10.50) (12.50) (14.50) (1.63) I.E. B-I-I I.E. B-I-I 1.21 2.57 1.89 23 0.79 2.22 1.51 2.07 3.07 2.25 4.18 3.22 2.76 4.43 3.59 1.63 1.68 1.66 2.06 2.91 2.48 1.28 4.00 2.64 3.12 5.32 4.21 1.13 1.84 1.48 4.04 aan Return On Equity (%) 13 Return On Equity scores are based on a 20% or 20 point weighting. Bolded numbers indicate achievement of the investor expected ROE shown below each yearly column head. Highlighted numbers indicate best-in-industry performances for each year. Game-To-Date scores are based on a weighted average of the annual ROE performances. For more information, click the Help button (above-right). Y6 Y7 Y8 Y9 Y 10 Y11Y12 13 14 15 Wgt. Avg. Y7 Score G-T-D Score (17.5) (20.0) (25.0) (30.0) (35.0) (40.0) (42.5) (45.0) (47.5) (50.0) (18.8) I.E. B-I-I I.E. B-I-I 19.1 31.3 26.0 24 24 11 13.0 29.1 21.9 24 12 22 30.6 38.9 35.7 32.9 41.5 38.0 24 16 38.8 41.4 40.4 25.0 20.5 22.5 30.5 31.4 31.1 24 13 20.1 34.4 42.9 49.9 47.0 24 20 18.0 23.7 21.1 22 9 15 MOO UWLUIH 44.4 Stock Price ($ per share) A B Stock Price scores are based on a 20% or 20 point weighting. Bold numbers indicate achievement of the investor expected stock price shown below each yearly column head. Highlighted numbers indicate best-in-industry performance for each year. Game-To-Date scores are based solely on the most recent year's stock price. For more information, click the Help button (above-right). Y6 Y7 Y8Y9Y10 11 12 13 14 15 Y7 Score G-T-D Score (20.00) (35.00) (60.00) (100.00) (150.00) (200.00) (250.00) (300.00) (330.00) (350.00) I.E. B-I-I I.E. B-I-I 27.06 75.66 24 9 8.74 64.50 24 7 24 7 64.01 132.36 70.03 137.29 91.06 146.09 - 17 24 17 43.75 38.84 63.15 87.03 32.64 128.23 102.61 175.00 22.42 46.74 24 15 HITMOOD G Credit Rating Credit Rating scores are based on a 20% or 20 point weighting. Bolded credit ratings indicate achieving or exceeding the investor expected EPS shown below each yearly column head. For Best-In-Industry scoring, an A+ credit rating earns a score of 100 points (lesser credit ratings earn lower scores). Game-To-Date scores are based solely on the most recent year's credit rating. Y6 Y7Y8Y9Y10Y11 Y12 Y13 Y14 Y15 Y7 Score G-T-D Score (B+) (B+) (A-) (A-) (A-) (A) (A) (A) (A) (A) I.E. B-I-I I.E. B-I-I 22 18 16 2016 23 1923 19 23 19 23 19 18 22 UHITIMOOOD Image Rating Image Rating scores are based on a 20% or 20 point v indicate achieving or exceeding the investor expected image rating shown below each yearly column head. Highlighted numbers indicate best-in-industry performances for each year. Game-To- Date scores are based on an average of each company's image ratings for the most recent three years. Y6 Y7 Y8 Y9Y10 Y11 Y12 Y 13 Y14Y15 Y5-Y7 Y7 Score G-T-D Score (70) (72) (72) (75) (75) (77) (77) (80) (80) (80) Average I.E. B-I-I I.E. B-I-I 77 73 2018 2118 70 21 18 19 19 A 79 21 19 UHITIMO 21 18 Corporate Social Responsibility and Citizenship Industry 1 Cash Outlays for Corporate Image Rating Points Social Responsibility and Citizenship Generated from Total Dollars (5000s) Per Unit Sold (S/unit) CSRC Expenditures High Average Low High Average Low High Average Low 15,442 5,797 0 18.21 5.86 0.00 6 3 0 19,240 6,0720 16.90 5.56 0.009 4 0 Corporate Responsibility Award for Exemplary Corporate Citizenship Beginning in Year 9, the World Council for Exemplary Corporate Citizenship presents a distinguished award to the company making the highest cash outlays as a percentage of revenues for corporate social respon- sibility and citizenship initiatives. Award Winner 2nd Place Year 6 Year 7 Year 8 Year 9 Year 10 Year 11 Year 12 Year 13 Year 14 Year 15 Y9 Y10 Y11 Y12 Y13 Y14 Y15 Year 7 Scoreboard Journal 24-Feb-20 Investor Best-In- Weighted Expectation Industry Average Score Score Score Change from Y6 Rank Company Name Industry 1 117 +1 BUSN 440 SP 2020 116 116 108 103 101 100 +18 100 +5 Year 7 I-SAKE E Company Halcyon C-Power Electronics D-DALM Action Pro G Company A Company B PerfectShot J Company F Company COVOAAWN 116 114 114 113 110 +10 105 99 Game-To-Date Scoreboard Investor Best-In- Weighted Expectation Industry Average Score Score Score Overall G-T-D Score Bonus Points Rank 117 116 108 103 116 101 108 103 100 100 98 101 voowwN- Company Name I-SAKE E Company C-Power Electronics Halcyon D-DALM Action Pro G Company A Company B PerfectShot J Company F Company 117 114 113 113 106 105 103 91 89 79 O


