

Question: I am not able to plot using matplotlib. The plot will look like this. I also have the same problem for df.plot.box() or for histogram.
I am not able to plot using matplotlib. The plot will look like this. I also have the same problem for df.plot.box() or for histogram.
Please check the screenshot
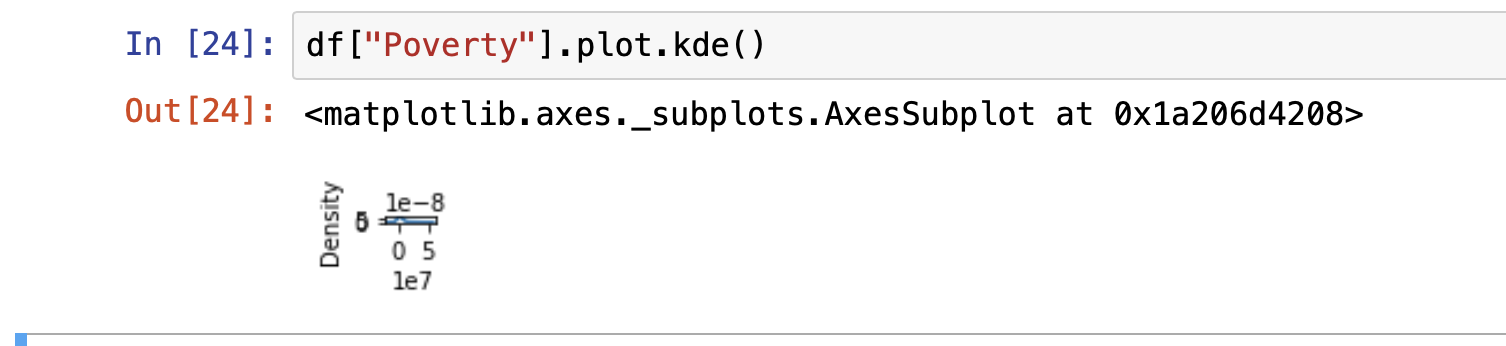
In [24]: df["Poverty").plot.kde() Out [24]:
Step by Step Solution
There are 3 Steps involved in it
1 Expert Approved Answer
Step: 1 Unlock

Question Has Been Solved by an Expert!
Get step-by-step solutions from verified subject matter experts
Step: 2 Unlock
Step: 3 Unlock