

Question: I am not sure how to answer the question for number 6: How to set up the SML graph or what data to include on
I am not sure how to answer the question for number 6: How to set up the SML graph or what data to include on each axis.
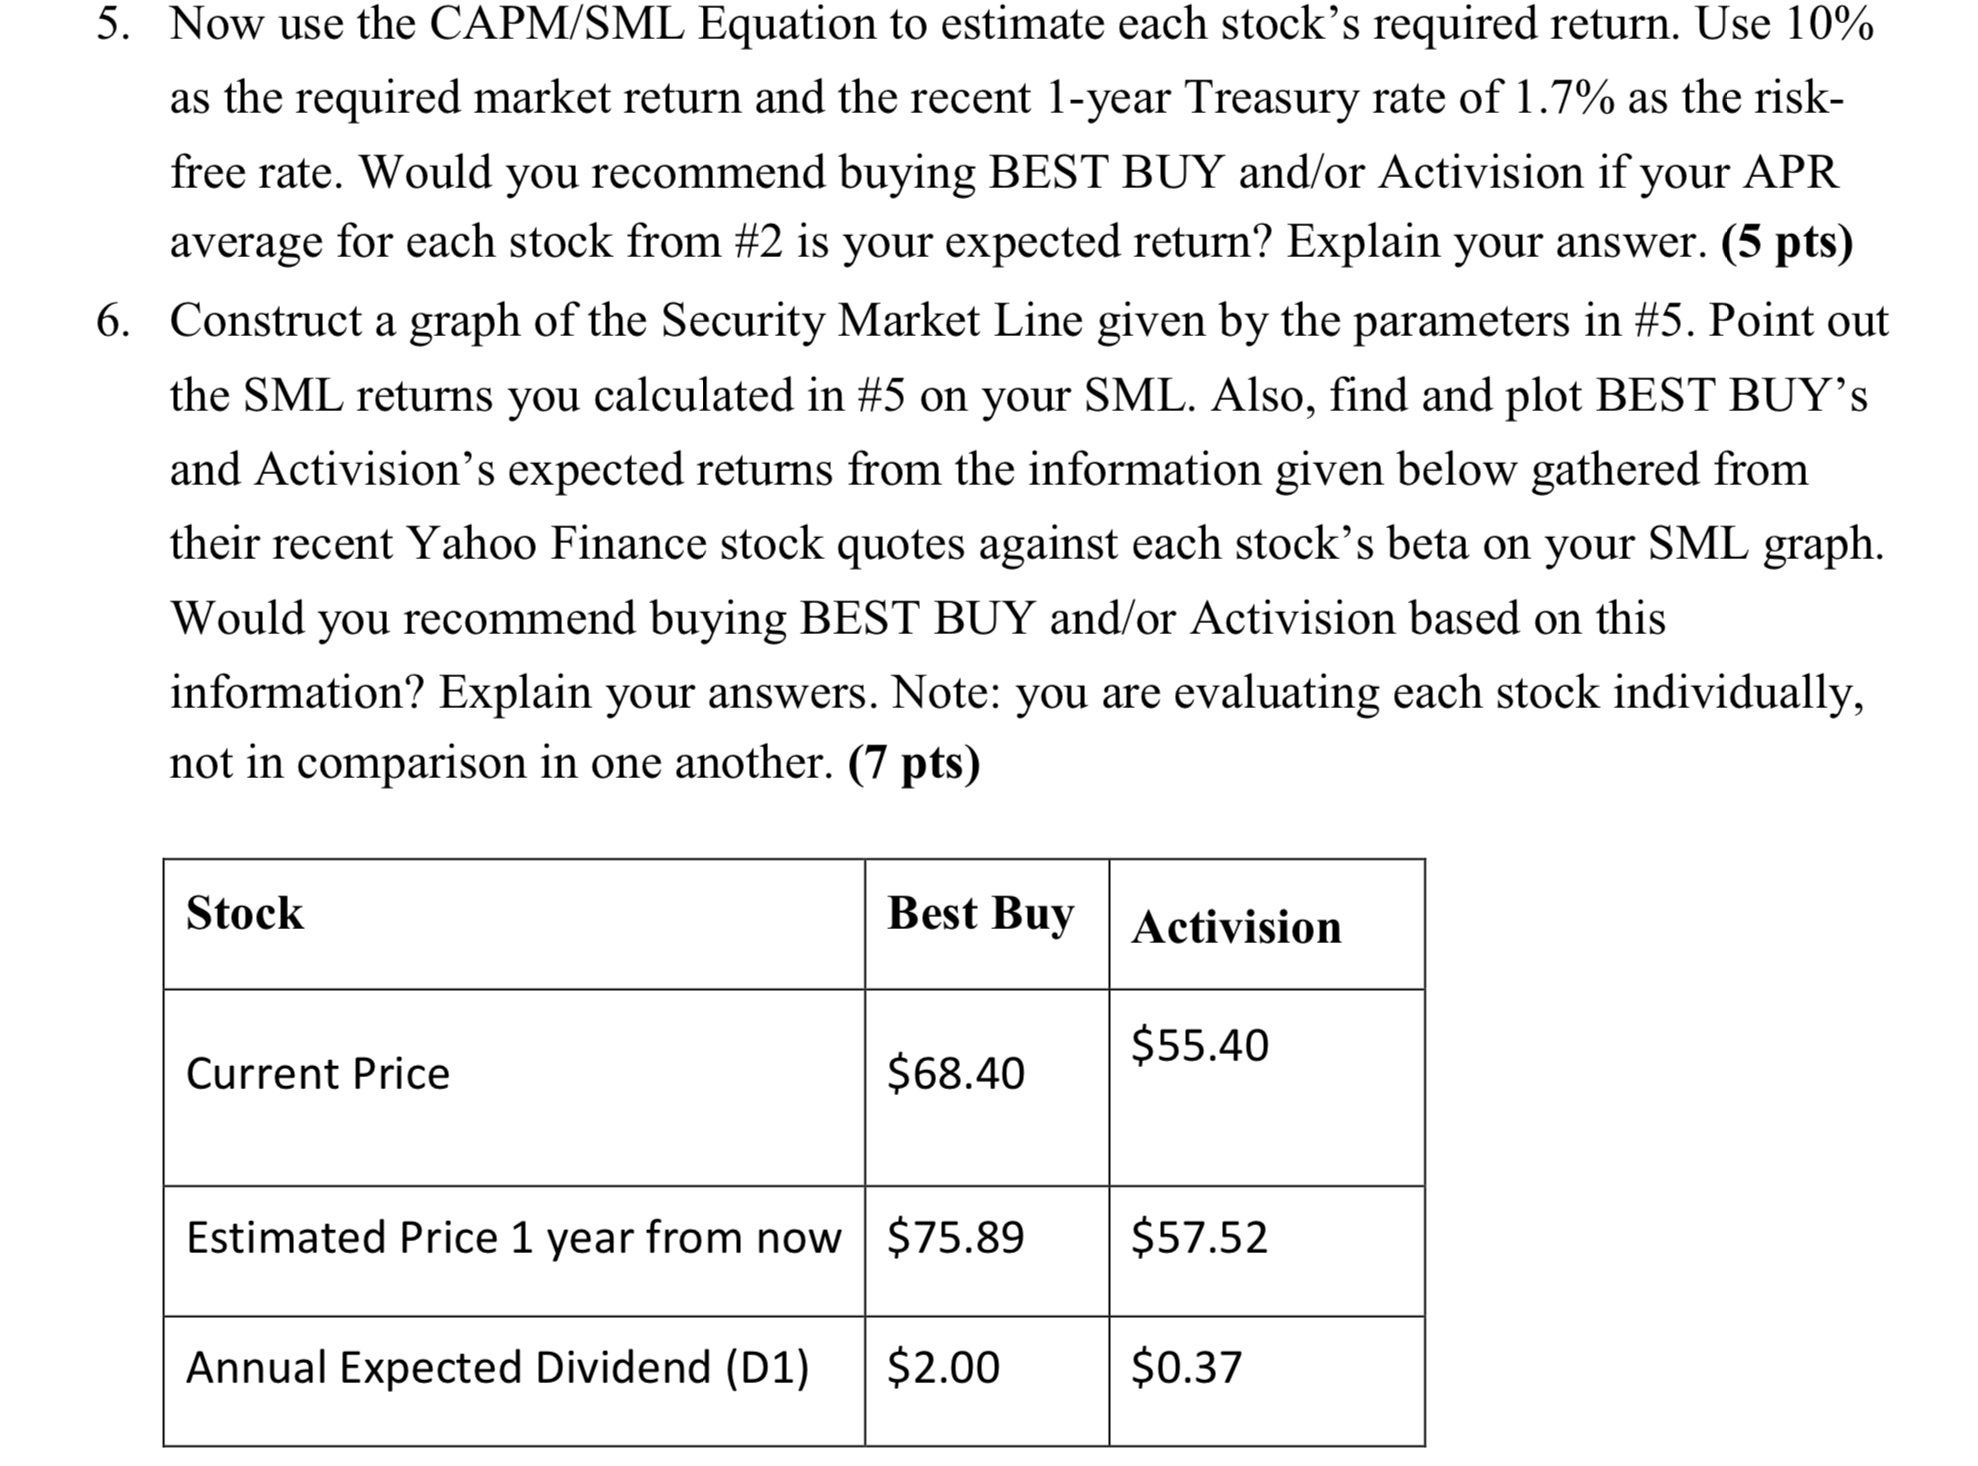
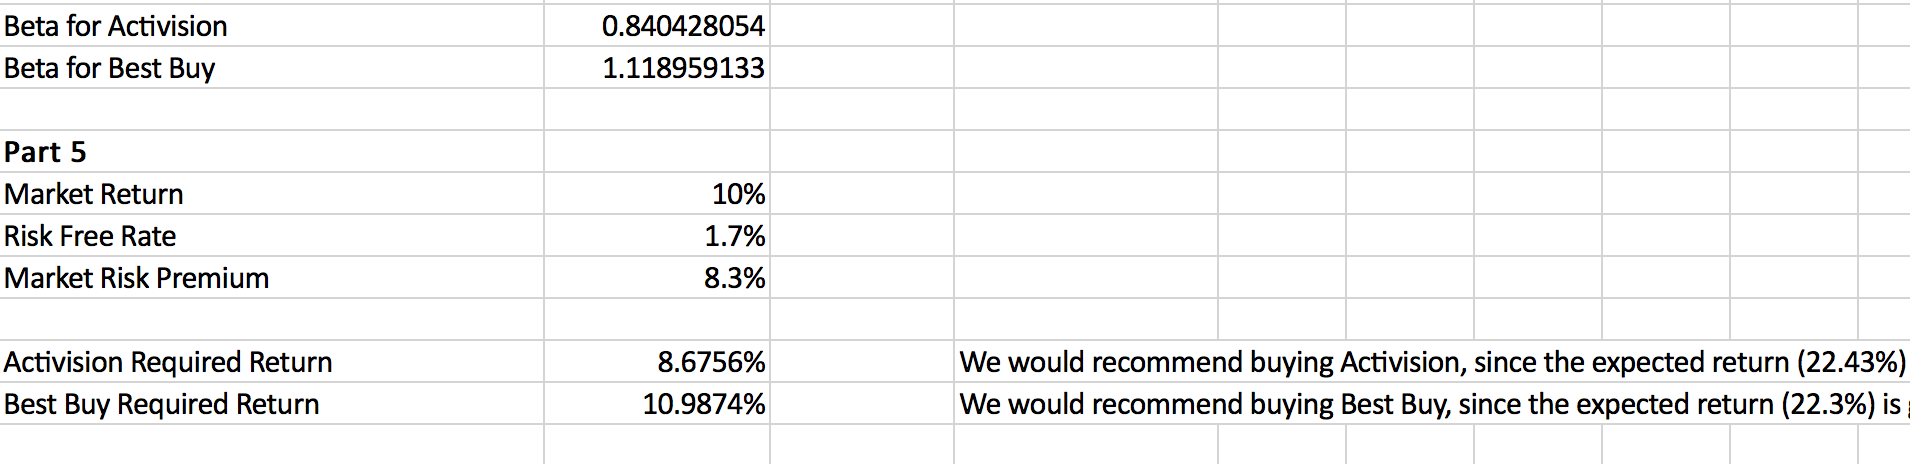
5. Now use the CAPM/SML Equation to estimate each stock's required return. Use 10% as the required market return and the recent l-year Treasury rate of 1.7% as the risk- free rate. Would you recommend buying BEST BUY and/or Activision if your APR average for each stock from #2 is your expected return? Explain your answer. (5 pts) 6. Construct a graph of the Security Market Line given by the parameters in #5. Point out the SML returns you calculated in #5 on your SML. Also, nd and plot BEST BUY's and Activision's expected returns from the information given below gathered from their recent Yahoo Finance stock quotes against each stock's beta on your SML graph. Would you recommend buying BEST BUY and/or Activision based on this information? Explain your answers. Note: you are evaluating each stock individually, not in comparison in one another. (7 pts) \"84 $5540 Estimated Price 1 year from now $75.89 $57.52 Annual Expected Dividend (D1) $2.00 $0.37 Beta for Activision Beta for Best Buy Part 5 Market Return Risk Free Rate Market Risk Premium Activision Required Return Best Buy Required Return 0.840428054 1.118959 133 10% 1.7% 8.3% 8.6756% 10.9874% We would recommend buying Activision, since the expected return (22.43%) We would recommend buying Best Buy, since the expected return (22.3%) is
Step by Step Solution
There are 3 Steps involved in it

Get step-by-step solutions from verified subject matter experts