

Question: I am so confused about part b. I do not how to combine the lines into one plot. stat38 R - Mc Bb Welco Micro
I am so confused about part b. I do not how to combine the lines into one plot.
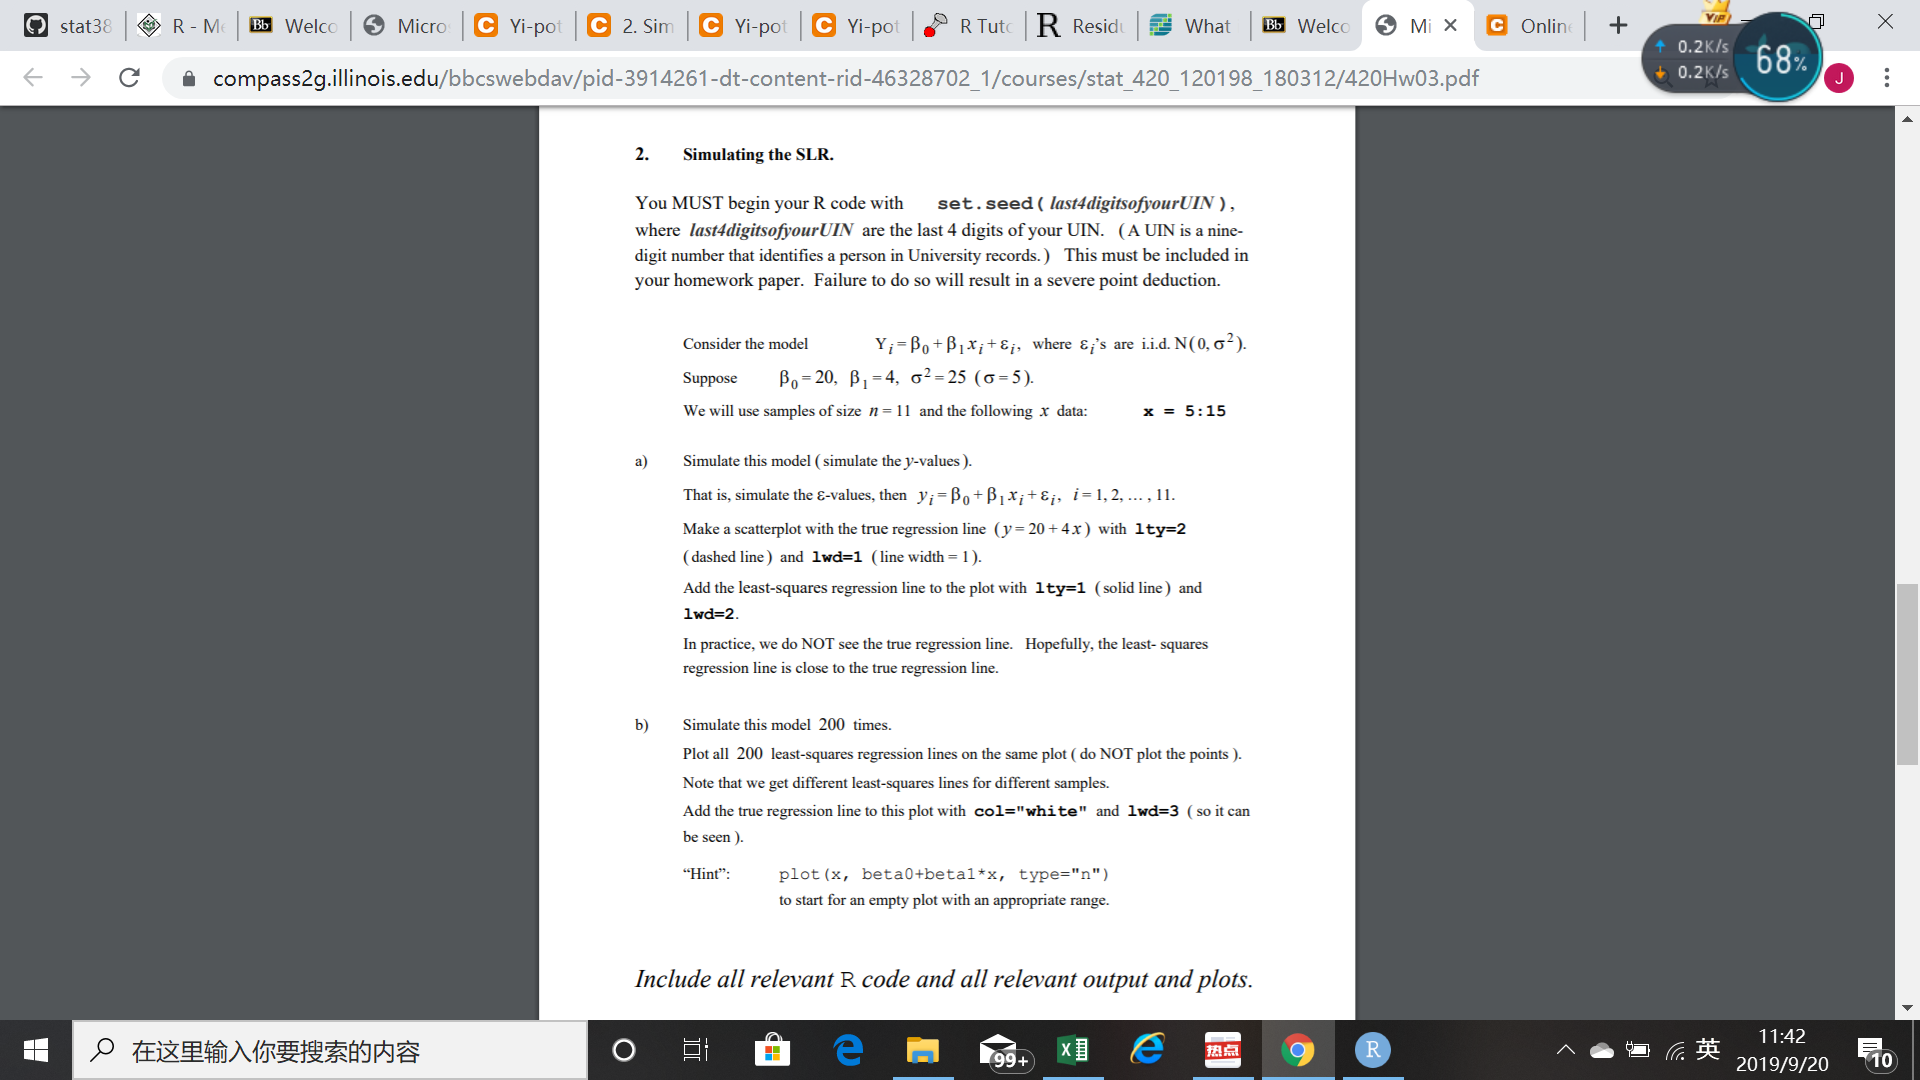
stat38 R - Mc Bb Welco Micro C Yi-pot C 2. Sim C Yi-pot C Yi-pot . RTutc|R Reside What BL Welco Mi X C Online + 17 X 0.2K/s C A compass2g.illinois.edu/bbcswebdav/pid-3914261-dt-content-rid-46328702_1/courses/stat_420_120198_180312/420Hw03.pdf 0.2K/s 68% 2. Simulating the SLR. You MUST begin your R code with set. seed ( last4digitsofyourUIN ) , where last4digitsofyourUIN are the last 4 digits of your UIN. ( A UIN is a nine- digit number that identifies a person in University records. ) This must be included in your homework paper. Failure to do so will result in a severe point deduction. Consider the model Yi=BotBixitE;, where &;'s are i.i.d. N(0, 62). Suppose Bo= 20, B1 =4, 62 =25 (6=5). We will use samples of size n = 11 and the following x data: x = 5:15 a) Simulate this model ( simulate the y-values ). That is, simulate the E-values, then y; = Bot BIX; +&;, i=1, 2, ..., 11. Make a scatterplot with the true regression line ()=20 + 4x ) with Ity=2 ( dashed line ) and 1wd=1 (line width = 1). Add the least-squares regression line to the plot with Ity=1 (solid line ) and 1wd=2. In practice, we do NOT see the true regression line. Hopefully, the least- squares regression line is close to the true regression line. Simulate this model 200 times. Plot all 200 least-squares regression lines on the same plot ( do NOT plot the points ). Note that we get different least-squares lines for different samples. Add the true regression line to this plot with col="white" and 1wd=3 ( so it can be seen ). "Hint": plot (x, beta0+betal*x, type="n") to start for an empty plot with an appropriate range. Include all relevant R code and all relevant output and plots. O 99+ X R 11:42 2019/9/20 10
Step by Step Solution
There are 3 Steps involved in it

Get step-by-step solutions from verified subject matter experts