

Question: I am struggling with receiving the Mean absolute errors for each data set. I usually get a matrix of [1 2] instead of [1 1]

![data set. I usually get a matrix of [1 2] instead of](https://dsd5zvtm8ll6.cloudfront.net/si.experts.images/questions/2024/09/66f04f7e59c69_02166f04f7dd42a5.jpg)
![[1 1] and the value is incorrect. Also could you check the](https://dsd5zvtm8ll6.cloudfront.net/si.experts.images/questions/2024/09/66f04f7f1e14b_02266f04f7e95e17.jpg)
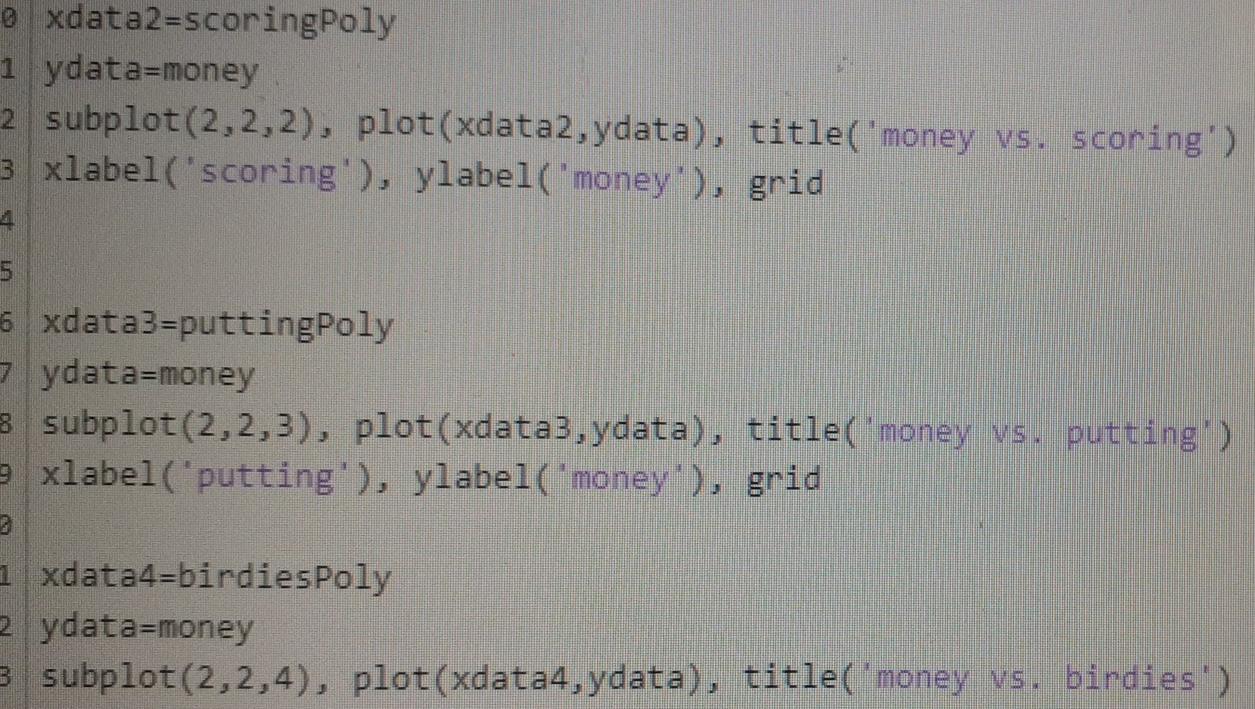
I am struggling with receiving the Mean absolute errors for each data set. I usually get a matrix of [1 2] instead of [1 1] and the value is incorrect. Also could you check the rest of the code I worked on?
Courses & Content LMS Integration Documentation & Support Finding the best correlation Write a script that performs the following operations 1. Place the stats data into 5 arrays named after the headings, one for each factor driving, scoring, putting, birdies money 2 Modify your previous script and use the function polyfit to determine the best-fit straight line for each of the Money vs. Factor data sets from the golfer data. Put the four polynomials In variables drivingpoly, scoringpoly puttingpoly, birdiesPoly, respectively. For help on using polyfit type help polyfit at the >> prompt in Matlab (not Matlab grader). or search the Mathworks documentation online, 3. Evaluate the four polynomials at the values of their associated factors to predict Money. Use the function polyval for the computation Save the computed values for Money based on each factor in variables driving values scoringMvalues putting values, birdiesmvalues. 4. Use MATLAB (and its ability to do array element-by-element calculations) to calculate the average (mean absolute (MAE) value of the error between the dollars predicted by the best- fit line and the dollars actually won for the Money vs. Factor data. This means that for each factor you will have a single "best-fit indicator with the units of dollars. Save these values in variables drivingnae, scoringMe puttingMe birdiesMAE 5. Which factor is the best predictor of financial success in professional golf? Save the best fit error in variable bestFitError, and the best fit factor in bestFit variable as follows. It driving is best, then bestFit-1; il scoring is best, then then bestfit=2; if putting is best, then bestFit=3; and if birdies is best, then bestFit-4. Hint: Look up min function 6. Plot the best-fit lines and the four data sets for all four Money vs. Factor data as one figure using four subplots, one piot for each factor. The y axis of each plot should be money and the x axis will be one of the factors (eg putting). Data should be shown only using markers, no line. The best-fit lines should be shown as lines without markers. Clearly title and label each subplot. The labels of the x axis for each piot must be one of factor names, eg, draving, scoring, putting, birdies Script Reset E MATLAB Documentation 1 load golfdata.txt I load data from file into matrix "golfdata 2 driving- [257.9; 262.1; 260.6; 269.2; 262.31 3 scoring- [78.21; 68.80; 71.06; 70.59; 70.38 ) 4 putting- [28.63; 30.82; 29.50; 28.83; 29.90] 5 birdies- [155; 199; 120; 188; 151] 6 money-[1073.545; 1849.654; 401.414; 419.417; 825.176] drivingPoly=polyfit(driving, money, 1); scoringPoly=polyfit(scoring, money, 1); puttingPoly-polyfit(putting, money, 1); birdies Poly-polyfit(birdies, money, 1); drivingMValues=polyval(drivingPoly, driving); scoringMValues=polyval(scoringPoly, scoring); puttingMValues=polyval (puttingPoly, putting); birdiesMValues=polyval(birdiesPoly, birdies); drivingMAE=mean(abs (drivingMValues-drivingPoly)); scoringMAE=mean(abs (scoringMValues-scoringPoly)); puttingMAE=mean(abs (puttingMValues-puttingPoly)); birdiesMAE=mean(abs (birdiesMValues-birdiesPoly)); 7. 3 A=[drivingMAE scoringMAE birdiesMAE] bestFitError=min(A); 5 5 if drivingMAE==bestFitError bestFit=1; 3 elseif scoringMAE==bestFitError bestFit=2; e else best Fit=3; e end 1 # xdatal=drivingPoly 5 ydata=money 5 subplot(2,2,1), plot(xdata1, ydata), title('money vs. driving') =xlabel('driving'), ylabel('money'), grid exdata2=scoringPoly 1 ydata=money 2 subplot(2,2,2), plot(xdata2, ydata), title('money vs. scoring') 3 xlabel('scoring'), ylabel('money'), grid 1 6 xdata3=puttingPoly zydata=money 3 subplot(2,2,3), plot(xdata3, ydata), title('money vs. putting') 9 xlabel('putting'), ylabel('money'), grid 1 xdata4=birdiesPoly zydata=money 3 subplot(2,2,4), plot(xdata4, ydata), title('money vs. birdies') Courses & Content LMS Integration Documentation & Support Finding the best correlation Write a script that performs the following operations 1. Place the stats data into 5 arrays named after the headings, one for each factor driving, scoring, putting, birdies money 2 Modify your previous script and use the function polyfit to determine the best-fit straight line for each of the Money vs. Factor data sets from the golfer data. Put the four polynomials In variables drivingpoly, scoringpoly puttingpoly, birdiesPoly, respectively. For help on using polyfit type help polyfit at the >> prompt in Matlab (not Matlab grader). or search the Mathworks documentation online, 3. Evaluate the four polynomials at the values of their associated factors to predict Money. Use the function polyval for the computation Save the computed values for Money based on each factor in variables driving values scoringMvalues putting values, birdiesmvalues. 4. Use MATLAB (and its ability to do array element-by-element calculations) to calculate the average (mean absolute (MAE) value of the error between the dollars predicted by the best- fit line and the dollars actually won for the Money vs. Factor data. This means that for each factor you will have a single "best-fit indicator with the units of dollars. Save these values in variables drivingnae, scoringMe puttingMe birdiesMAE 5. Which factor is the best predictor of financial success in professional golf? Save the best fit error in variable bestFitError, and the best fit factor in bestFit variable as follows. It driving is best, then bestFit-1; il scoring is best, then then bestfit=2; if putting is best, then bestFit=3; and if birdies is best, then bestFit-4. Hint: Look up min function 6. Plot the best-fit lines and the four data sets for all four Money vs. Factor data as one figure using four subplots, one piot for each factor. The y axis of each plot should be money and the x axis will be one of the factors (eg putting). Data should be shown only using markers, no line. The best-fit lines should be shown as lines without markers. Clearly title and label each subplot. The labels of the x axis for each piot must be one of factor names, eg, draving, scoring, putting, birdies Script Reset E MATLAB Documentation 1 load golfdata.txt I load data from file into matrix "golfdata 2 driving- [257.9; 262.1; 260.6; 269.2; 262.31 3 scoring- [78.21; 68.80; 71.06; 70.59; 70.38 ) 4 putting- [28.63; 30.82; 29.50; 28.83; 29.90] 5 birdies- [155; 199; 120; 188; 151] 6 money-[1073.545; 1849.654; 401.414; 419.417; 825.176] drivingPoly=polyfit(driving, money, 1); scoringPoly=polyfit(scoring, money, 1); puttingPoly-polyfit(putting, money, 1); birdies Poly-polyfit(birdies, money, 1); drivingMValues=polyval(drivingPoly, driving); scoringMValues=polyval(scoringPoly, scoring); puttingMValues=polyval (puttingPoly, putting); birdiesMValues=polyval(birdiesPoly, birdies); drivingMAE=mean(abs (drivingMValues-drivingPoly)); scoringMAE=mean(abs (scoringMValues-scoringPoly)); puttingMAE=mean(abs (puttingMValues-puttingPoly)); birdiesMAE=mean(abs (birdiesMValues-birdiesPoly)); 7. 3 A=[drivingMAE scoringMAE birdiesMAE] bestFitError=min(A); 5 5 if drivingMAE==bestFitError bestFit=1; 3 elseif scoringMAE==bestFitError bestFit=2; e else best Fit=3; e end 1 # xdatal=drivingPoly 5 ydata=money 5 subplot(2,2,1), plot(xdata1, ydata), title('money vs. driving') =xlabel('driving'), ylabel('money'), grid exdata2=scoringPoly 1 ydata=money 2 subplot(2,2,2), plot(xdata2, ydata), title('money vs. scoring') 3 xlabel('scoring'), ylabel('money'), grid 1 6 xdata3=puttingPoly zydata=money 3 subplot(2,2,3), plot(xdata3, ydata), title('money vs. putting') 9 xlabel('putting'), ylabel('money'), grid 1 xdata4=birdiesPoly zydata=money 3 subplot(2,2,4), plot(xdata4, ydata), title('money vs. birdies')
Step by Step Solution
There are 3 Steps involved in it

Get step-by-step solutions from verified subject matter experts