

Question: i am stuck in this answer me thumb will be up A company is analyzing the salary of its staff as compared to other companies
 i am stuck in this answer me thumb will be up
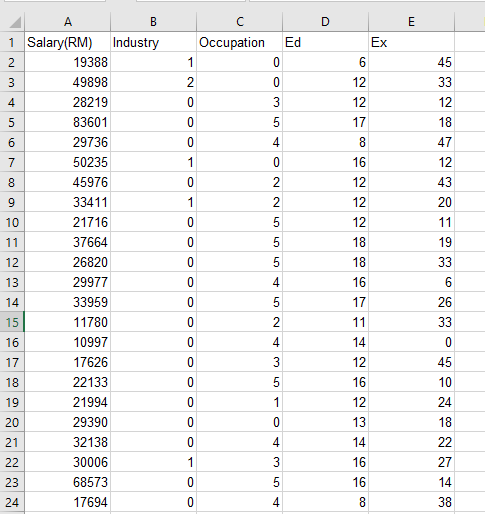
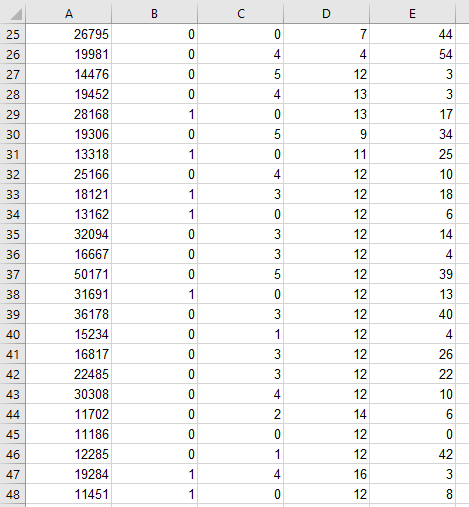
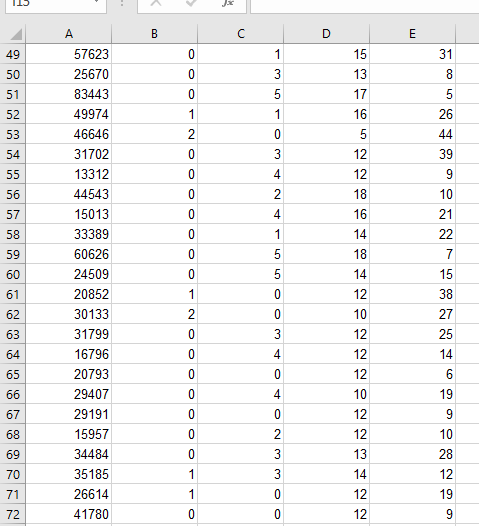
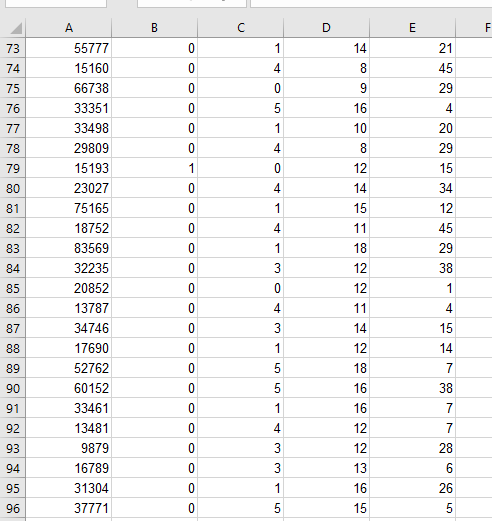
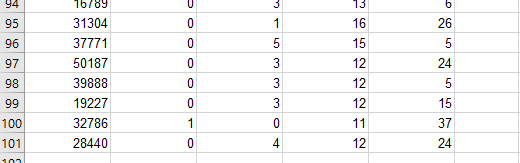
A company is analyzing the salary of its staff as compared to other companies in the same state. Please refer to the attached secondary data (as given in TIMES). These variables are included in the dataset: Salary(RM) Ed= Employee's years of education Ex = Employee's years of working experience (a) Draw an appropriate graph for the salary of the employees. Explain the graph briefly. [6 marks) (b) Based on the dataset given, obtain the descriptive statistics for the salary (in RM) and the employees' years of education [6 marks] A B D E Occupation Ed Ex 1 0 6 W N 0 m 12 N 0 0 3 5 0 3 5 12 17 0 4 1 0 45 33 12 18 47 12 43 20 11 19 33 00 0 N 8B22UB 9 1 2 0 6 5 01 01 0 0 0 01 1 Salary(RM) Industry 2 19388 3 49898 4 28219 5 83601 6 29736 7 50235 8 45976 9 33411 10 21716 11 37664 12 26820 13 29977 14 33959 15 11780 16 10997 17 17626 18 22133 19 21994 20 29390 21 32138 22 30006 23 68573 24 17694 5 4 4 0 5 01 26 33 OU 0 0 0 16 12 12 12 18 18 16 17 11 14 12 16 12 13 14 16 16 2 4 3 5 1 3 5 0 0 0 O HBHH bb8 45 10 24 18 22 27 14 38 0 4 1 3 5 0 0 4 A 00 B C D E 25 0 0 26 0 4 44 54 3 27 0 5 28 0 4 w 29 1 0 17 30 0 5 | 3uB 31 1 0 34 25 10 32 0 4 33 1 3 18 34 1 6 14 35 36 37 0 0 4 26795 19981 14476 19452 28168 19306 13318 25166 18121 13162 32094 16667 50171 31691 36178 15234 16817 22485 30308 11702 11186 12285 19284 11451 7 4 12 13 13 9 11 12 12 12 12 12 12 12 12 12 12 12 12 14 12 12 16 12 0 38 0 3 3 5 0 3 1 3 3 4 39 13 40 39 40 41 1 0 0 0 0 0 0 0 4 42 43 26 22 10 6 0 42 44 45 2 0 0 46 0 1 H 2 26 2 47 1 4 3 48 1 0 8
Step by Step Solution
There are 3 Steps involved in it

Get step-by-step solutions from verified subject matter experts