

Question: I am trying to create a plot in python with 1000 individual curves on it. The variables a, b, and c are all needing to
I am trying to create a plot in python with 1000 individual curves on it. The variables a, b, and c are all needing to range from -1 to 1 and I must plot 10 points in that range. The function is psi=asin(pi*x)+bsin(2*pi*x)+csin(3*pi*x). I posted what I have so far. Any help with this would be appreciated!
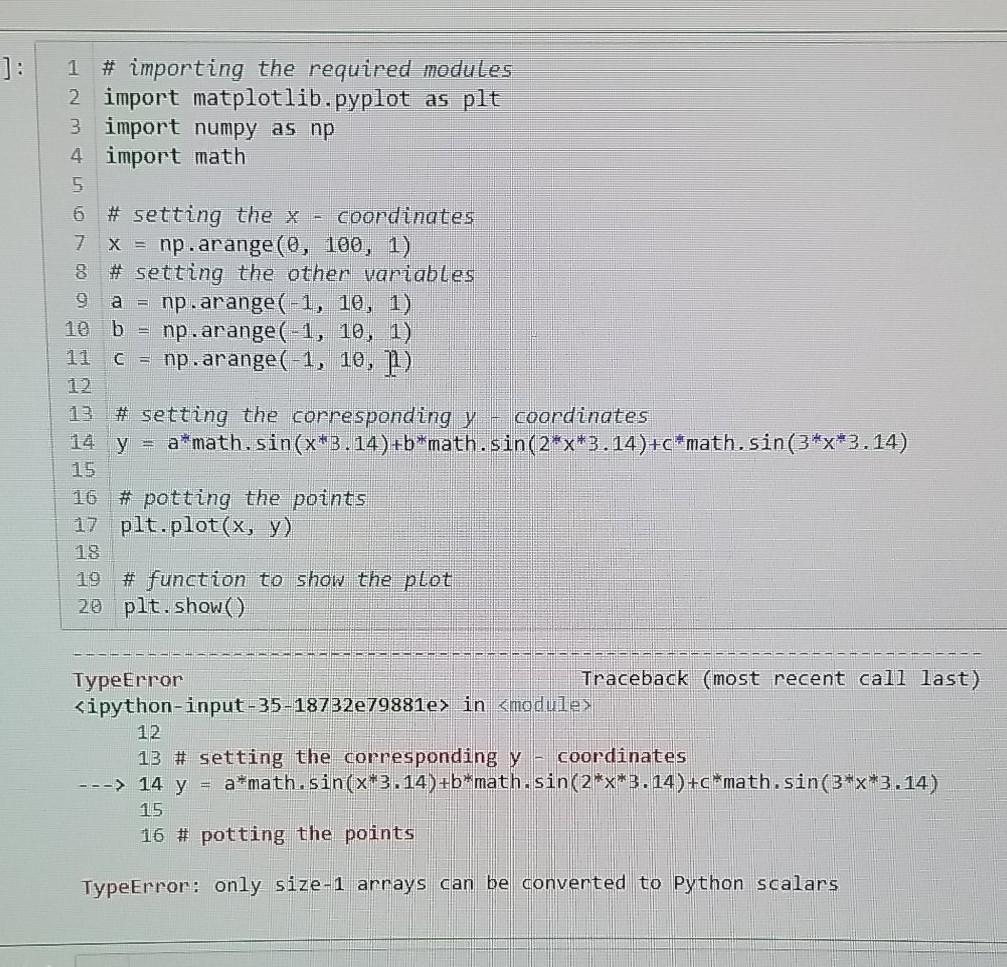
1 # importing the required modules 2 import matplotlib.pyplot as plt 3 import numpy as np 4 import math 5 # setting the x - coordinates 7 X = np.arange(0, 100, 1) 8 # setting the other variables 9 a = np.arange( -1, 10, 1) 10 b = np.arange(-1, 10, 1) 11 C = np.arange(-1, 10, P) 6 13 # setting the corresponding y -- coordinates 14 y = a*math.sin(x*3.14)+b*math.sin(2*x*3.14)+c math.sin(3*x*3.14) 15 16 # potting the points 17 plt.plot(x, y) # function to show the plot 20 plt.show() TypeError Traceback (most recent call last)
Step by Step Solution
There are 3 Steps involved in it

Get step-by-step solutions from verified subject matter experts