

Question: I am trying to create a simple scatter plot that shows the relationship between GDP and life expectancy across U.S. states. I have a data
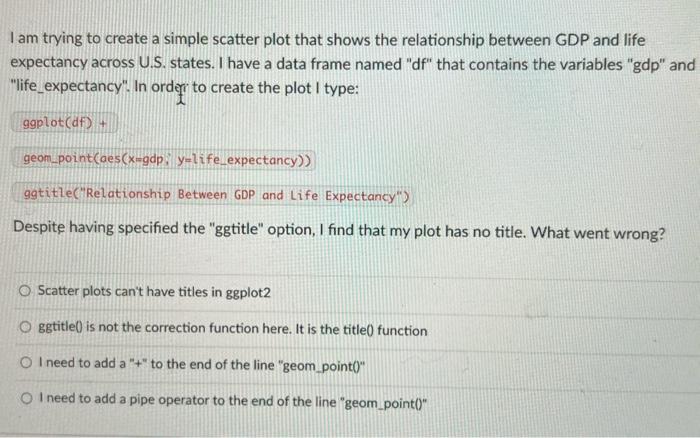
I am trying to create a simple scatter plot that shows the relationship between GDP and life expectancy across U.S. states. I have a data frame named "df" that contains the variables "gdp" and "life_expectancy". In order to create the plot I type: \[ \text { geom_point(aes } \left.\left(x=g d p ; y=l i f e \_e x p e c t a n c y ight) ight) \] ggtitle ("Relationship Between GDP and Life Expectancy") Despite having specified the "ggtitle" option, I find that my plot has no title. What went wrong? Scatter plots can't have titles in ggplot 2 ggtitle0) is not the correction function here. It is the title0 function I need to add a "+" to the end of the line "geom_point0" I need to add a pipe operator to the end of the line "geom_point()
Step by Step Solution
There are 3 Steps involved in it

Get step-by-step solutions from verified subject matter experts