

Question: I am trying to graph a fuction using matplotlib in Jupyter notebooks in python. My code is below. I don't understand why I am getting
I am trying to graph a fuction using matplotlib in Jupyter notebooks in python. My code is below. I don't understand why I am getting the error message.
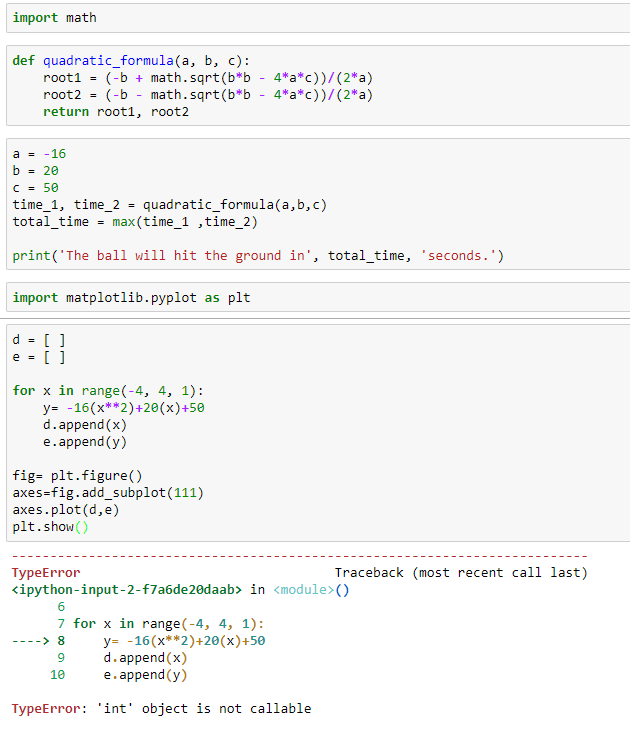
import math def quadratic_formula (a, b, c): root! root2 return (-b + (-b - rooti, math. sqrt(b*b math. sqrt(b*b root 4*a*c))/(2*a) 4*a*c))/(2*a) - - time-1, time-2 quadratic-formula(a,b,c) = total time max(time 1 ,time 2) print('The ball will hit the ground in', total_time, seconds. ') import matplotlib.pyplot as plt for x in range(-4, 4, 1): y-16(x* *2)+20 (x)+5e d.append(x) e.append (y) fig- plt.figure() axes-fig.add_subplot (111) axes plot(d,e) plt.show( Traceback (most recent call last) TypeError ipython-input-2-f7a6de20daabs in
Step by Step Solution
There are 3 Steps involved in it

Get step-by-step solutions from verified subject matter experts