

Question: I am using the Capsim program and need to play 4 rounds, the preliminary information given is : you will be taking over the Andrews
I am using the Capsim program and need to play 4 rounds, the preliminary information given is : you will be taking over the Andrews company that is having problems.
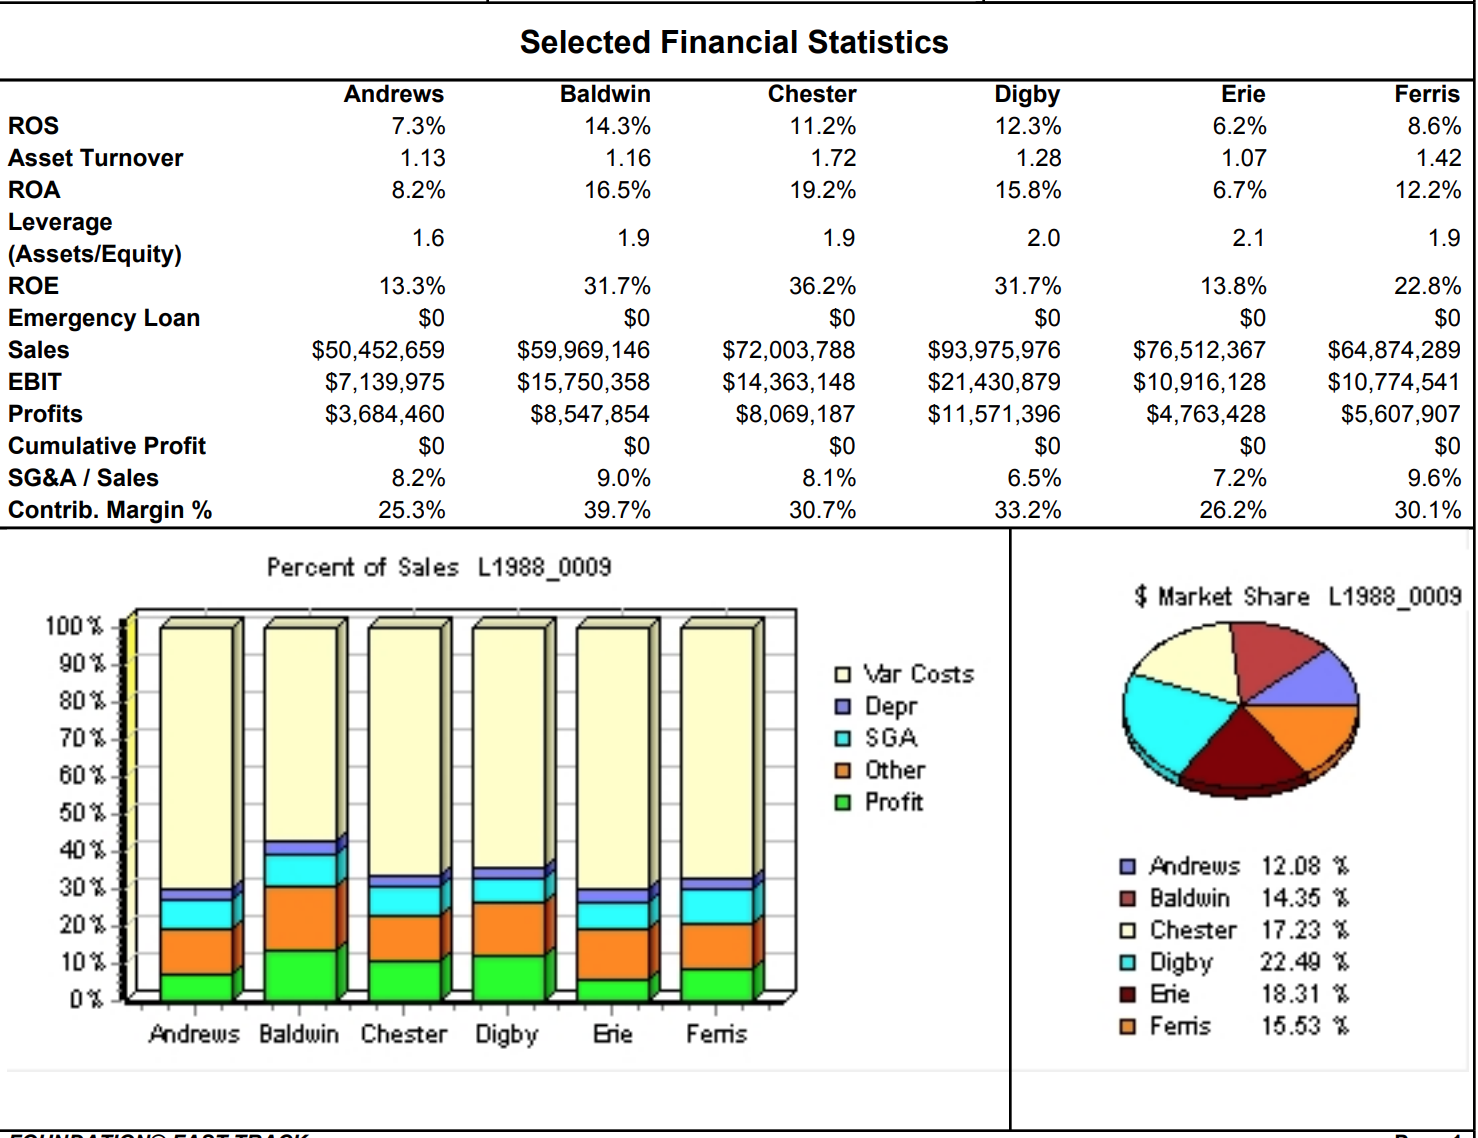
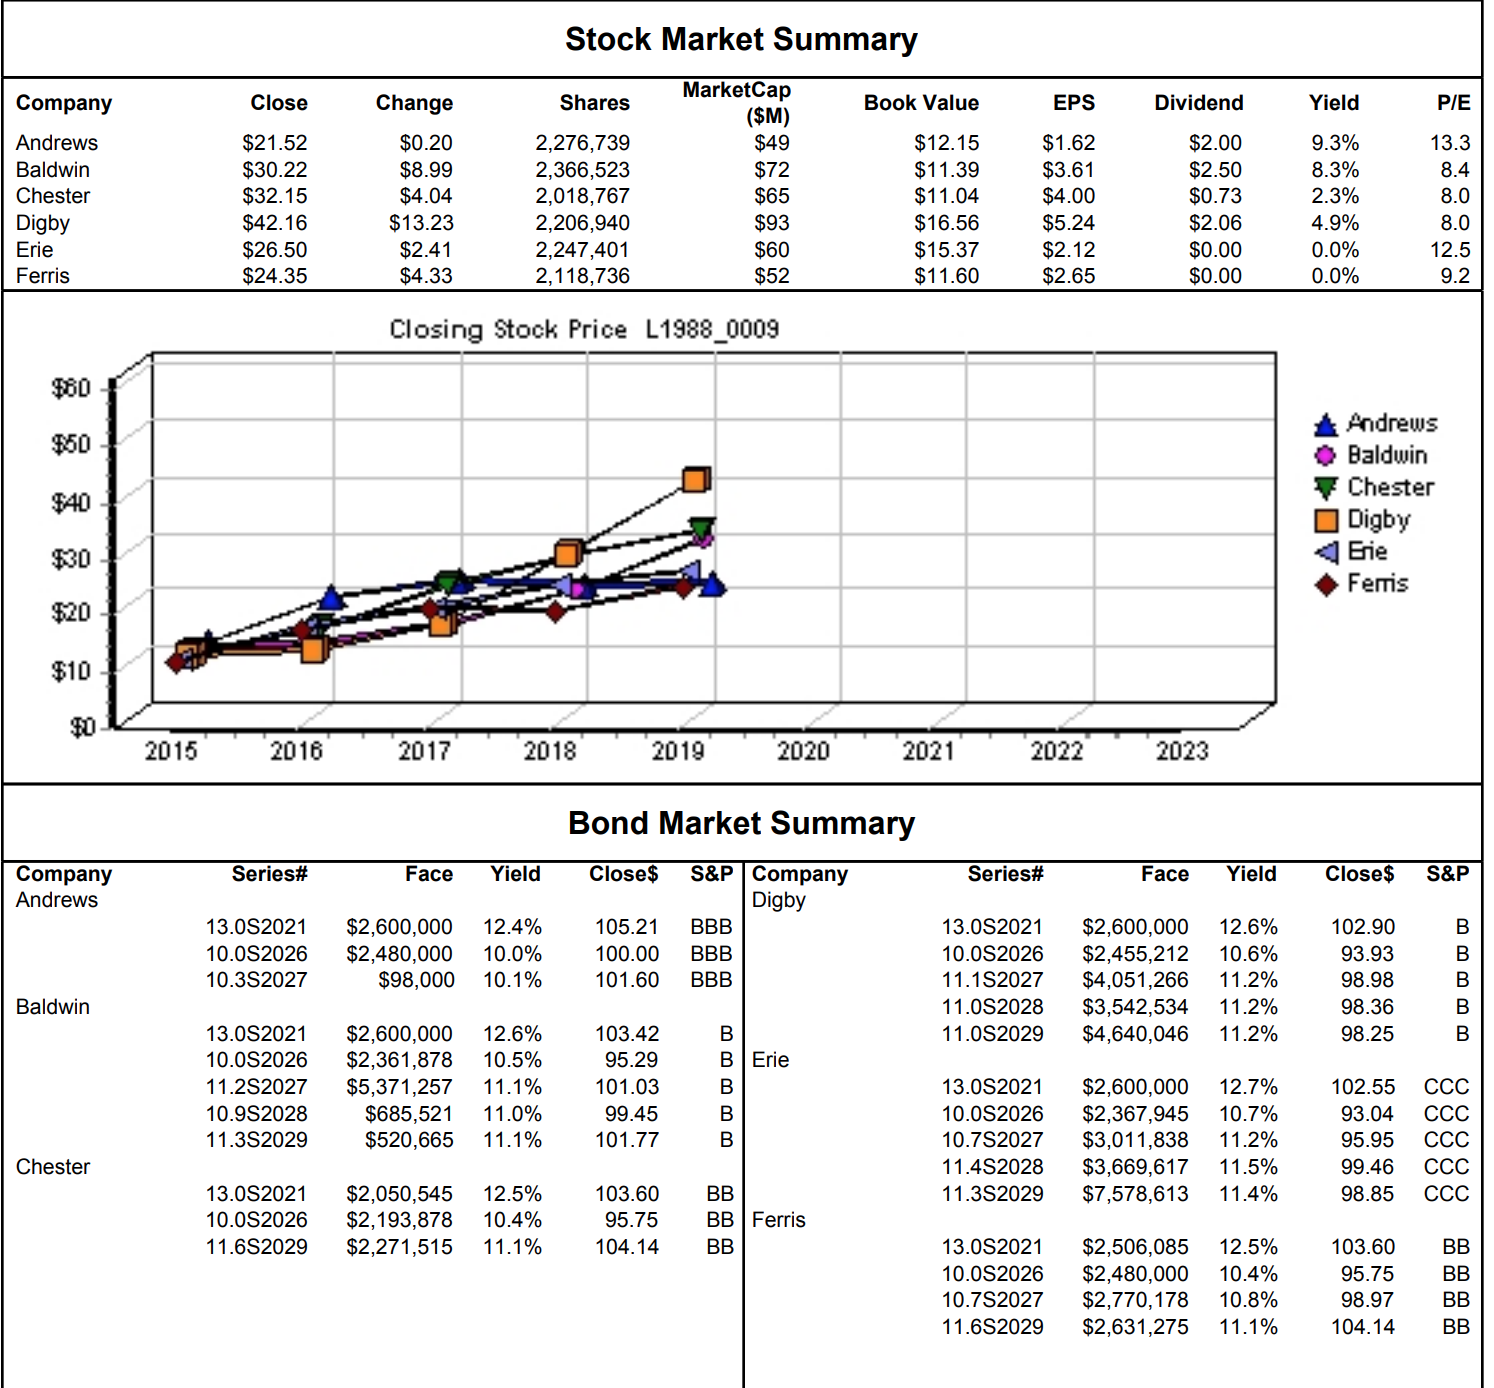
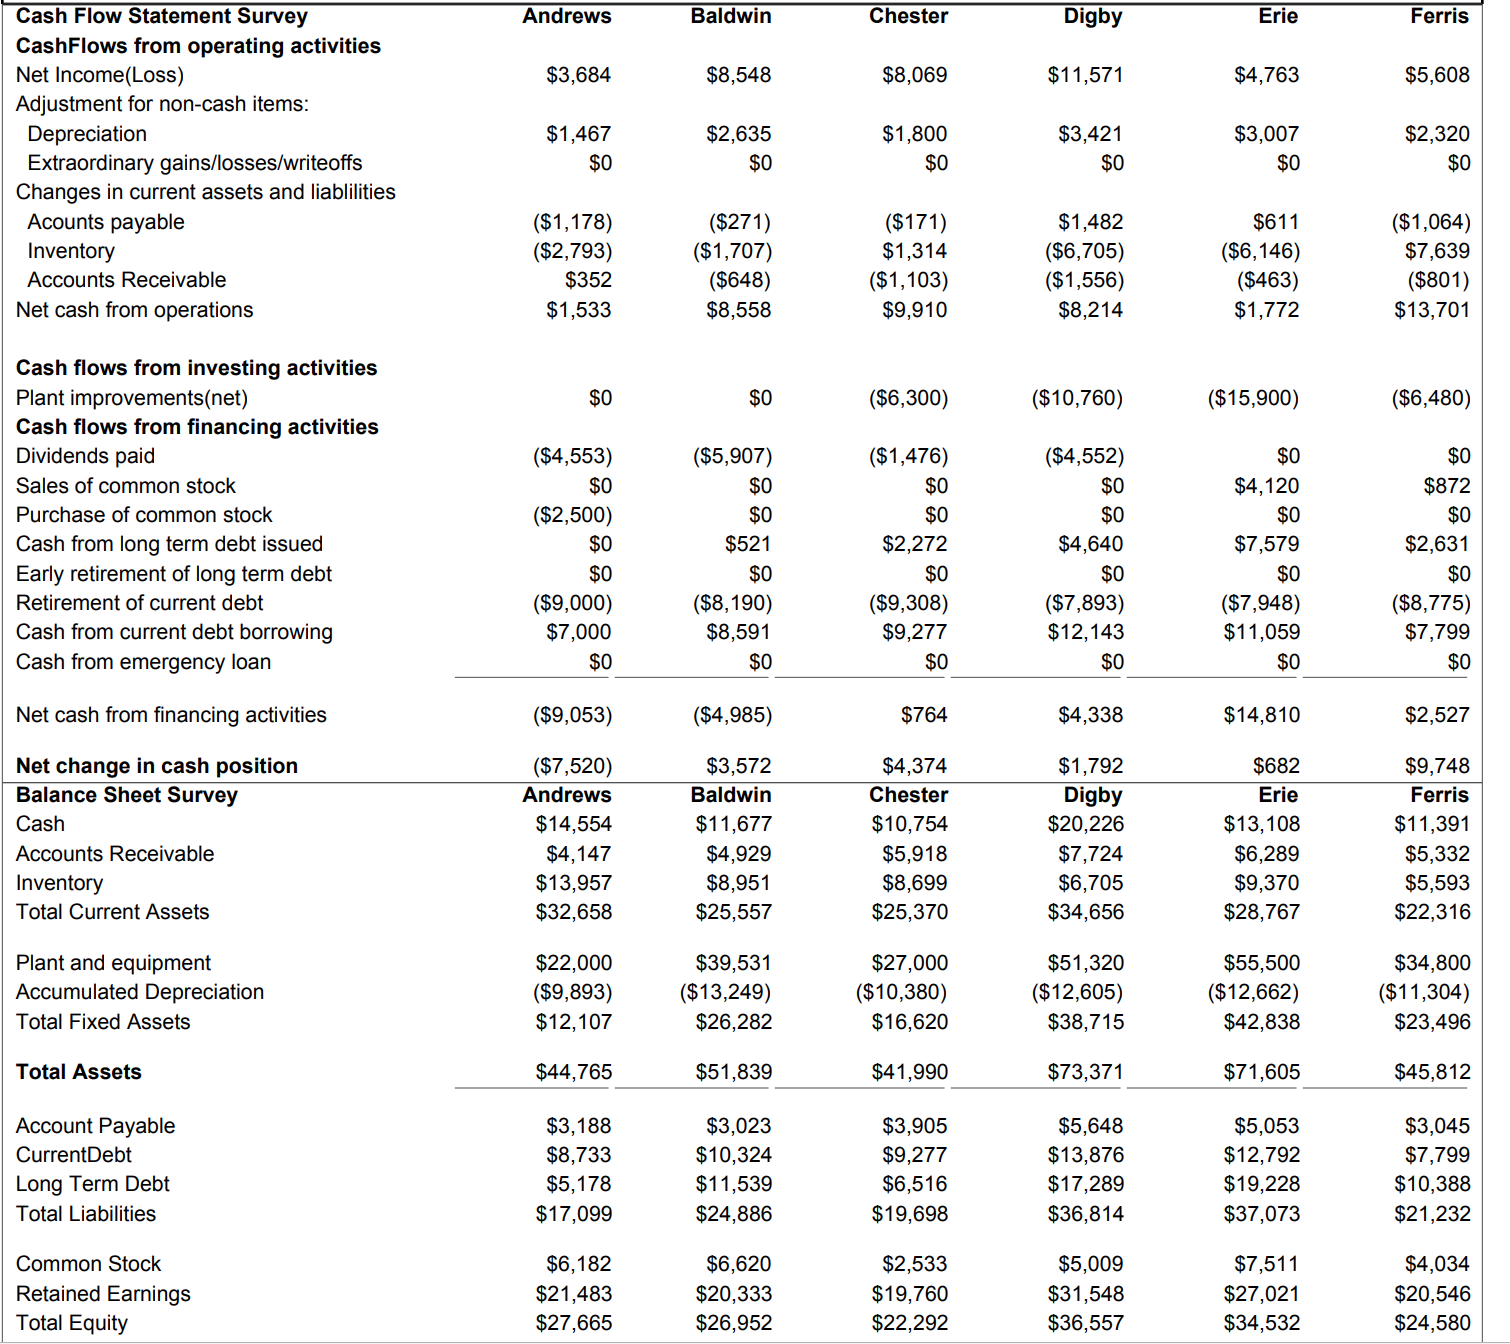
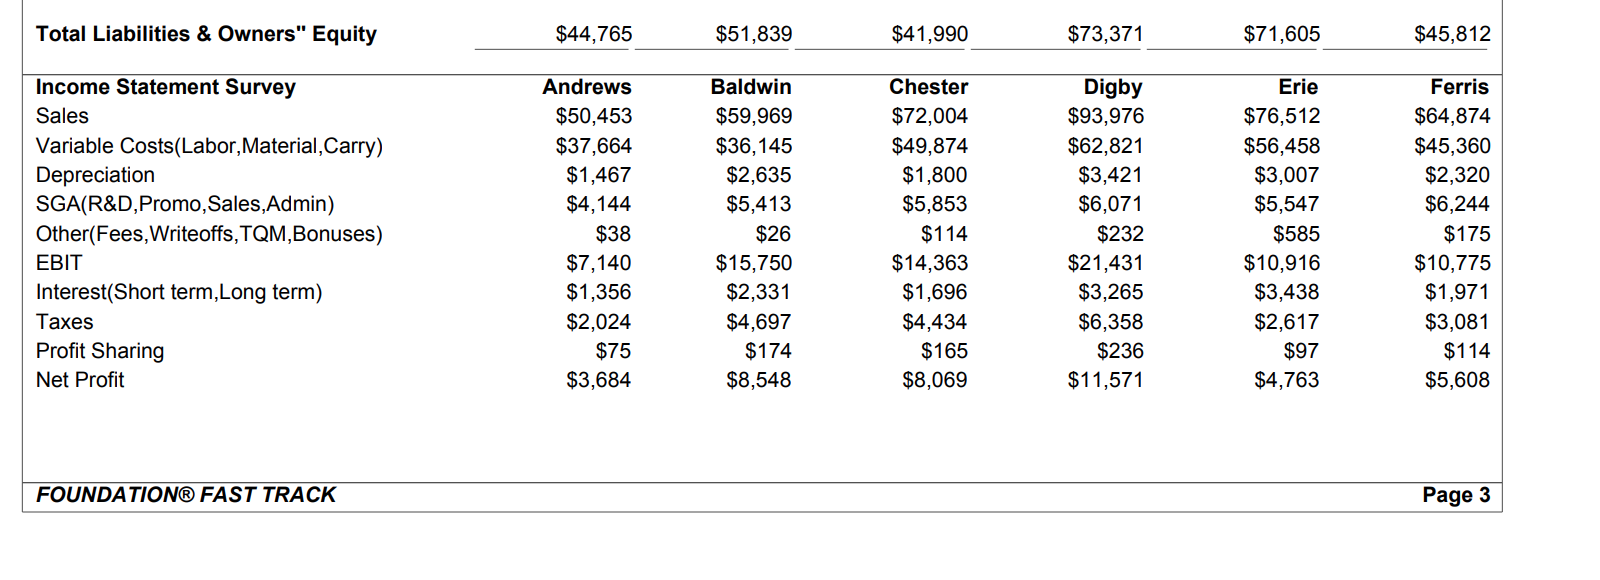
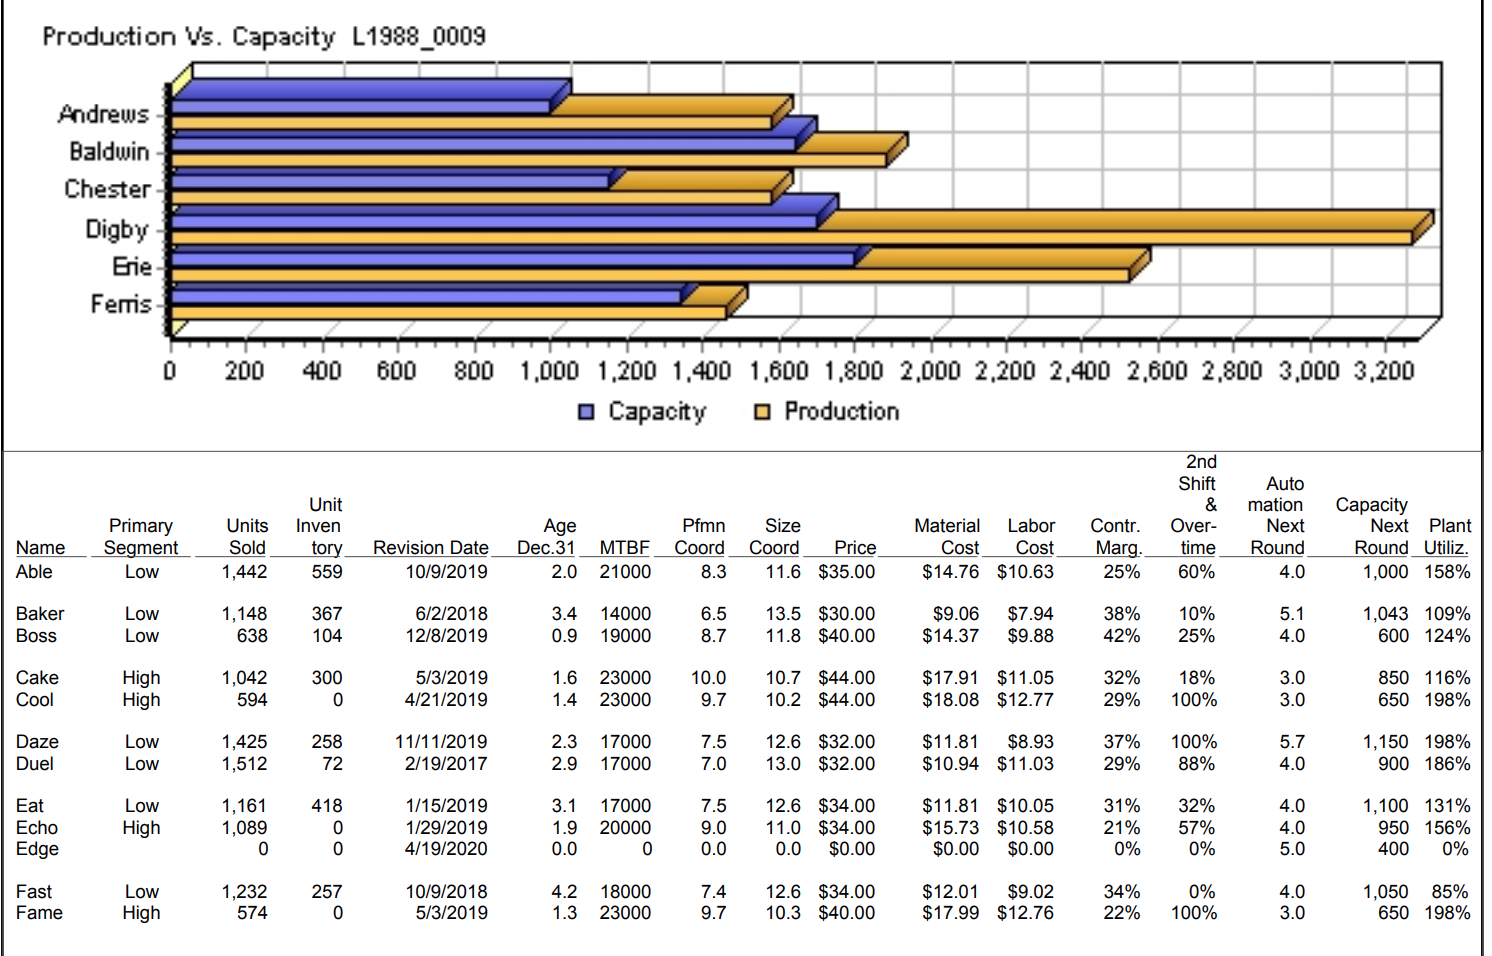
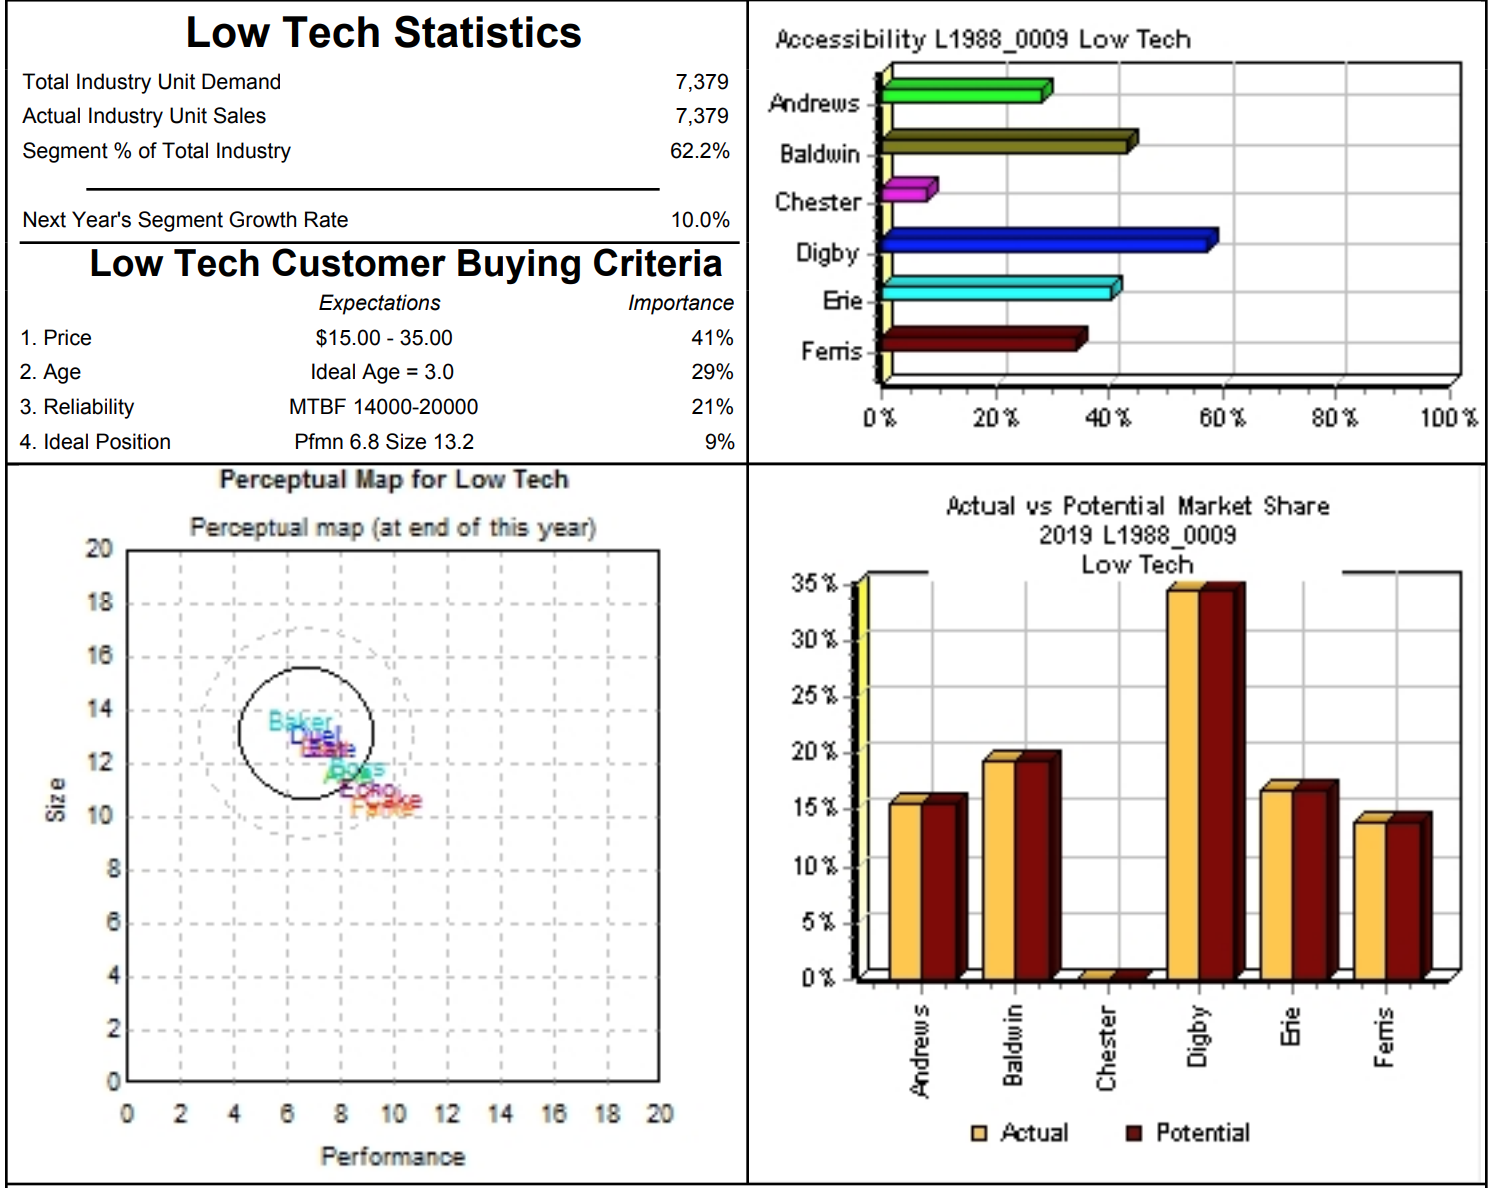
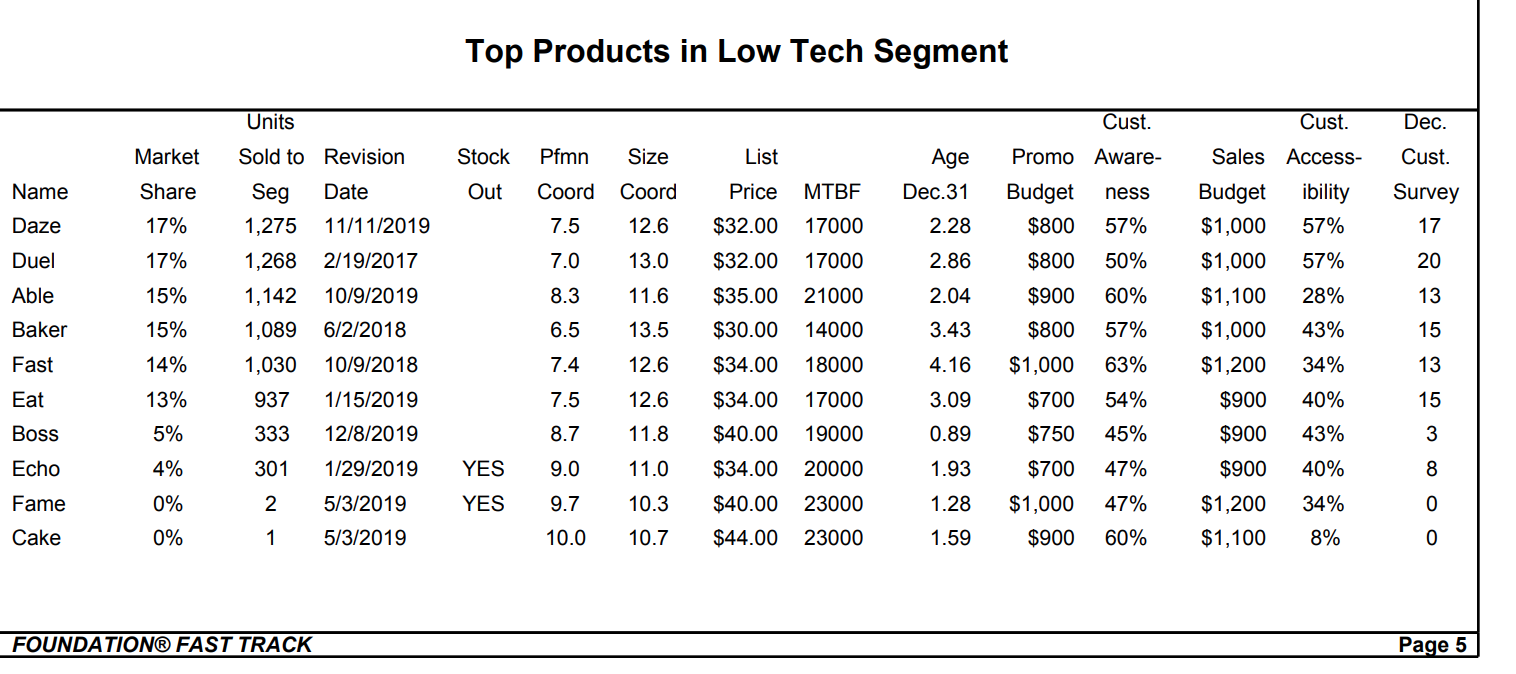
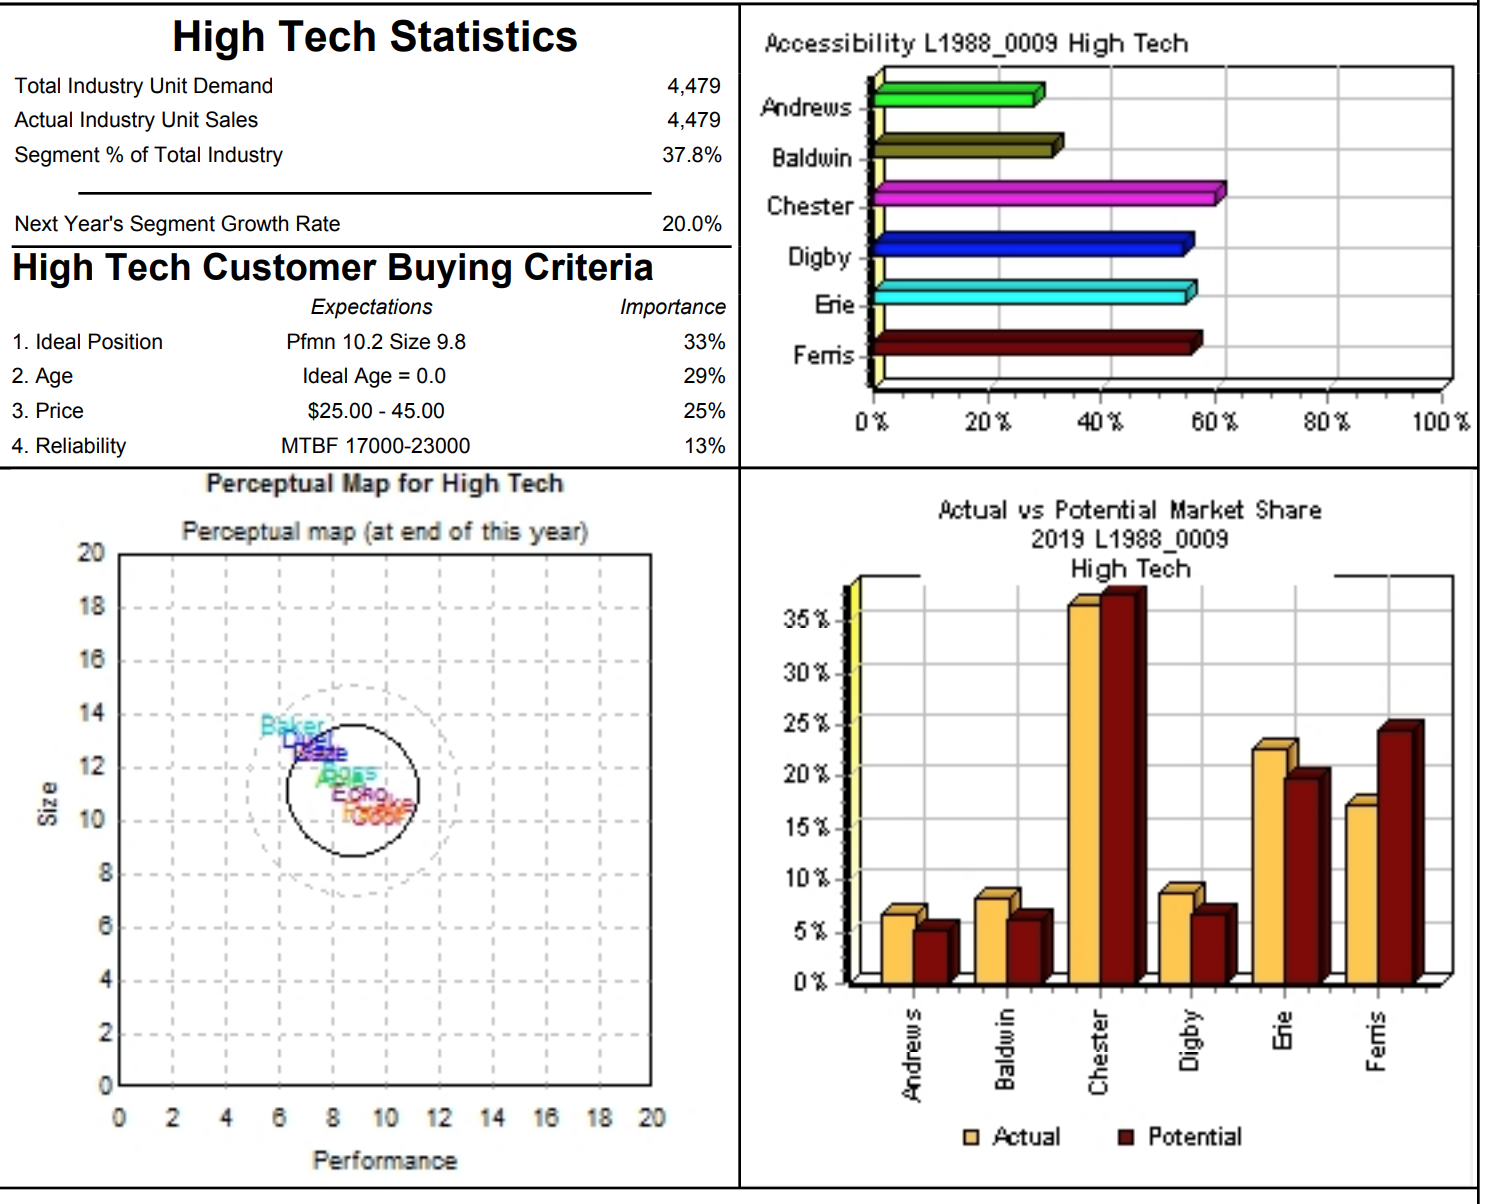
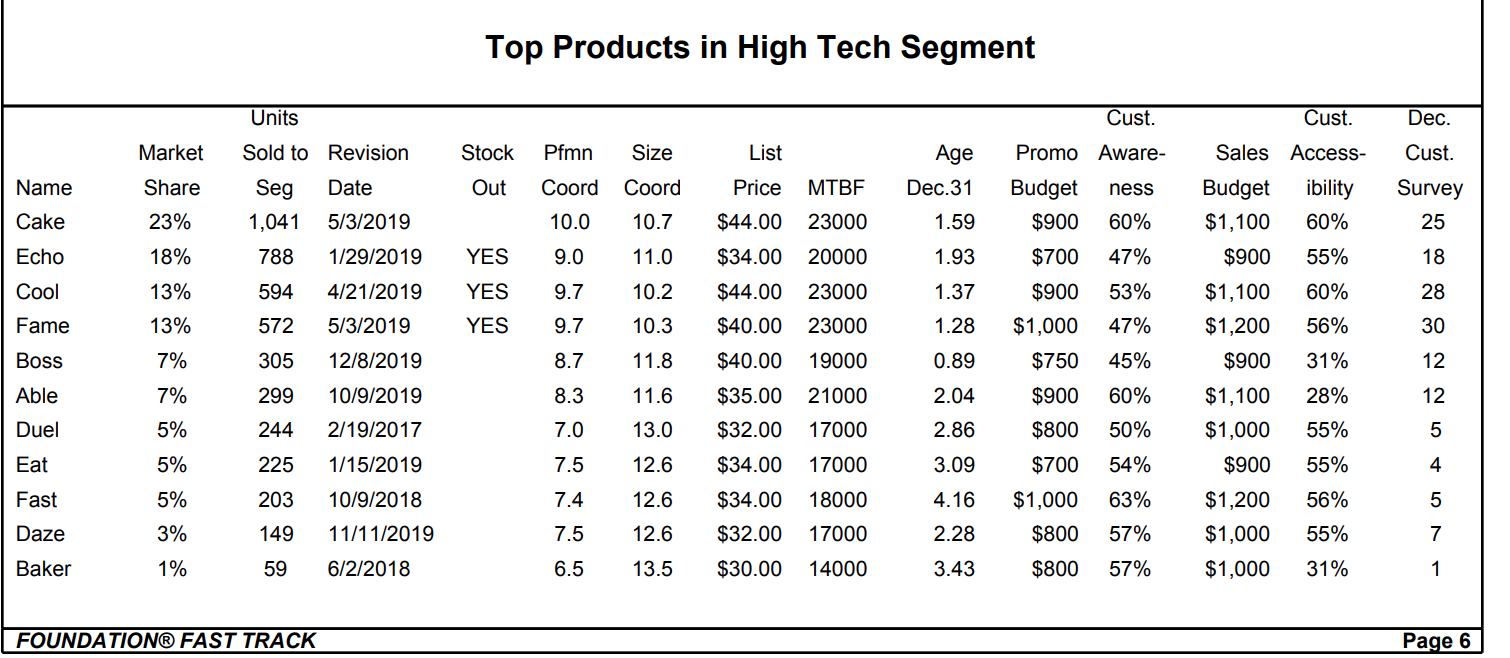
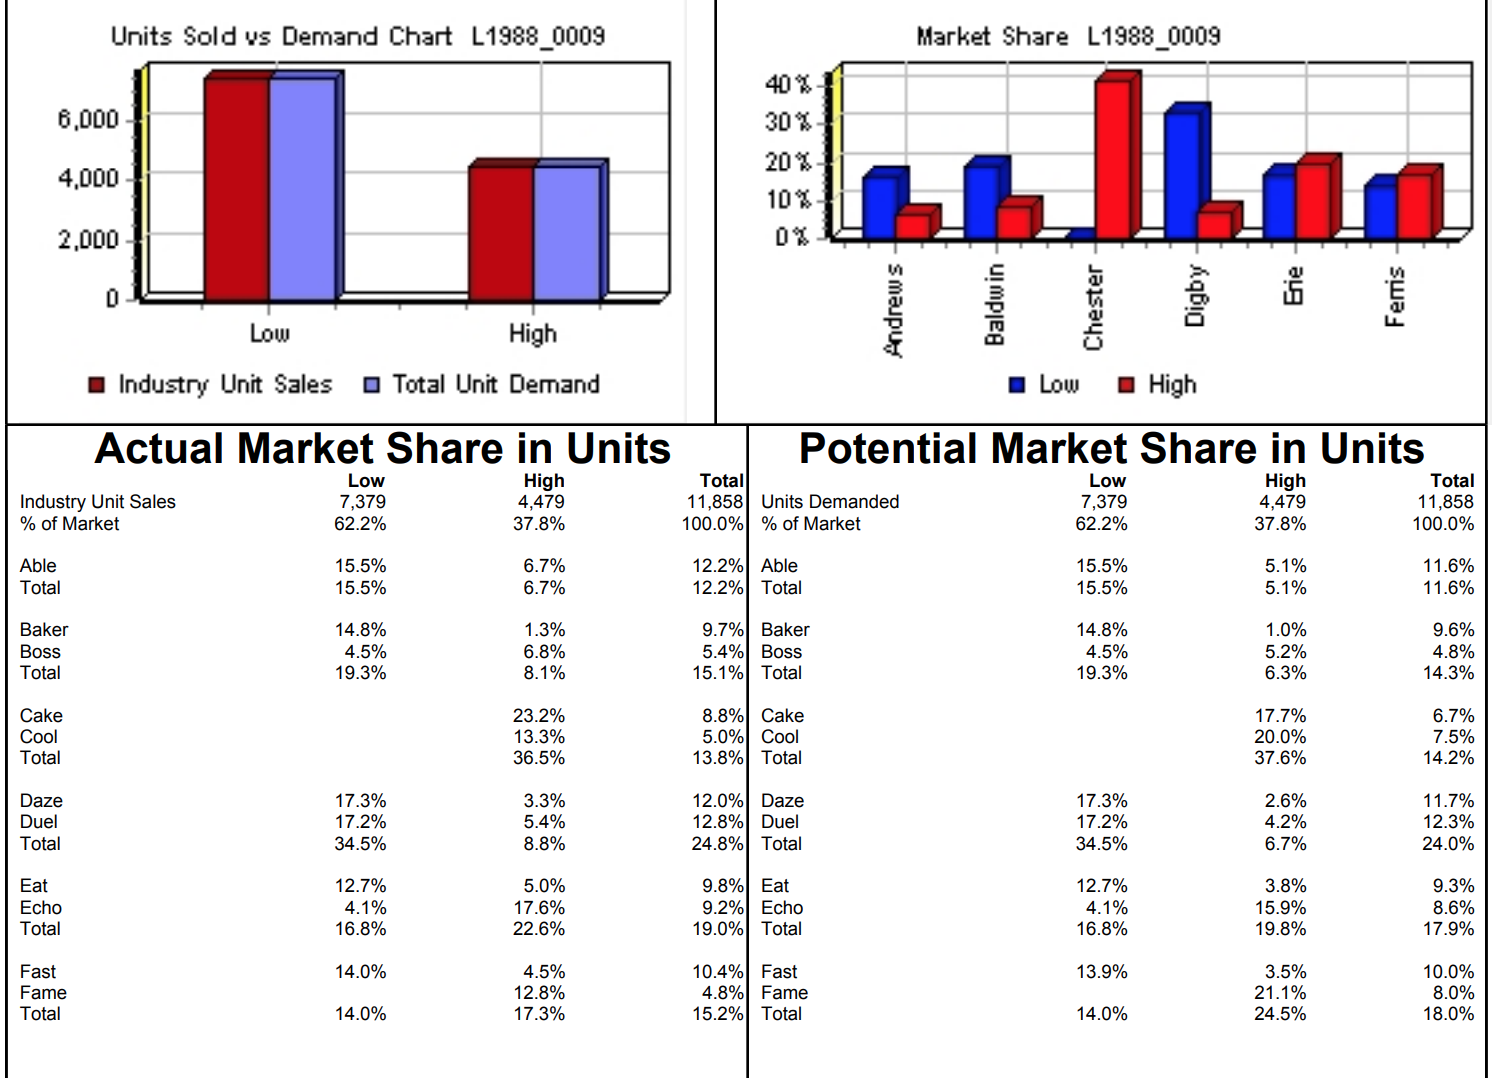
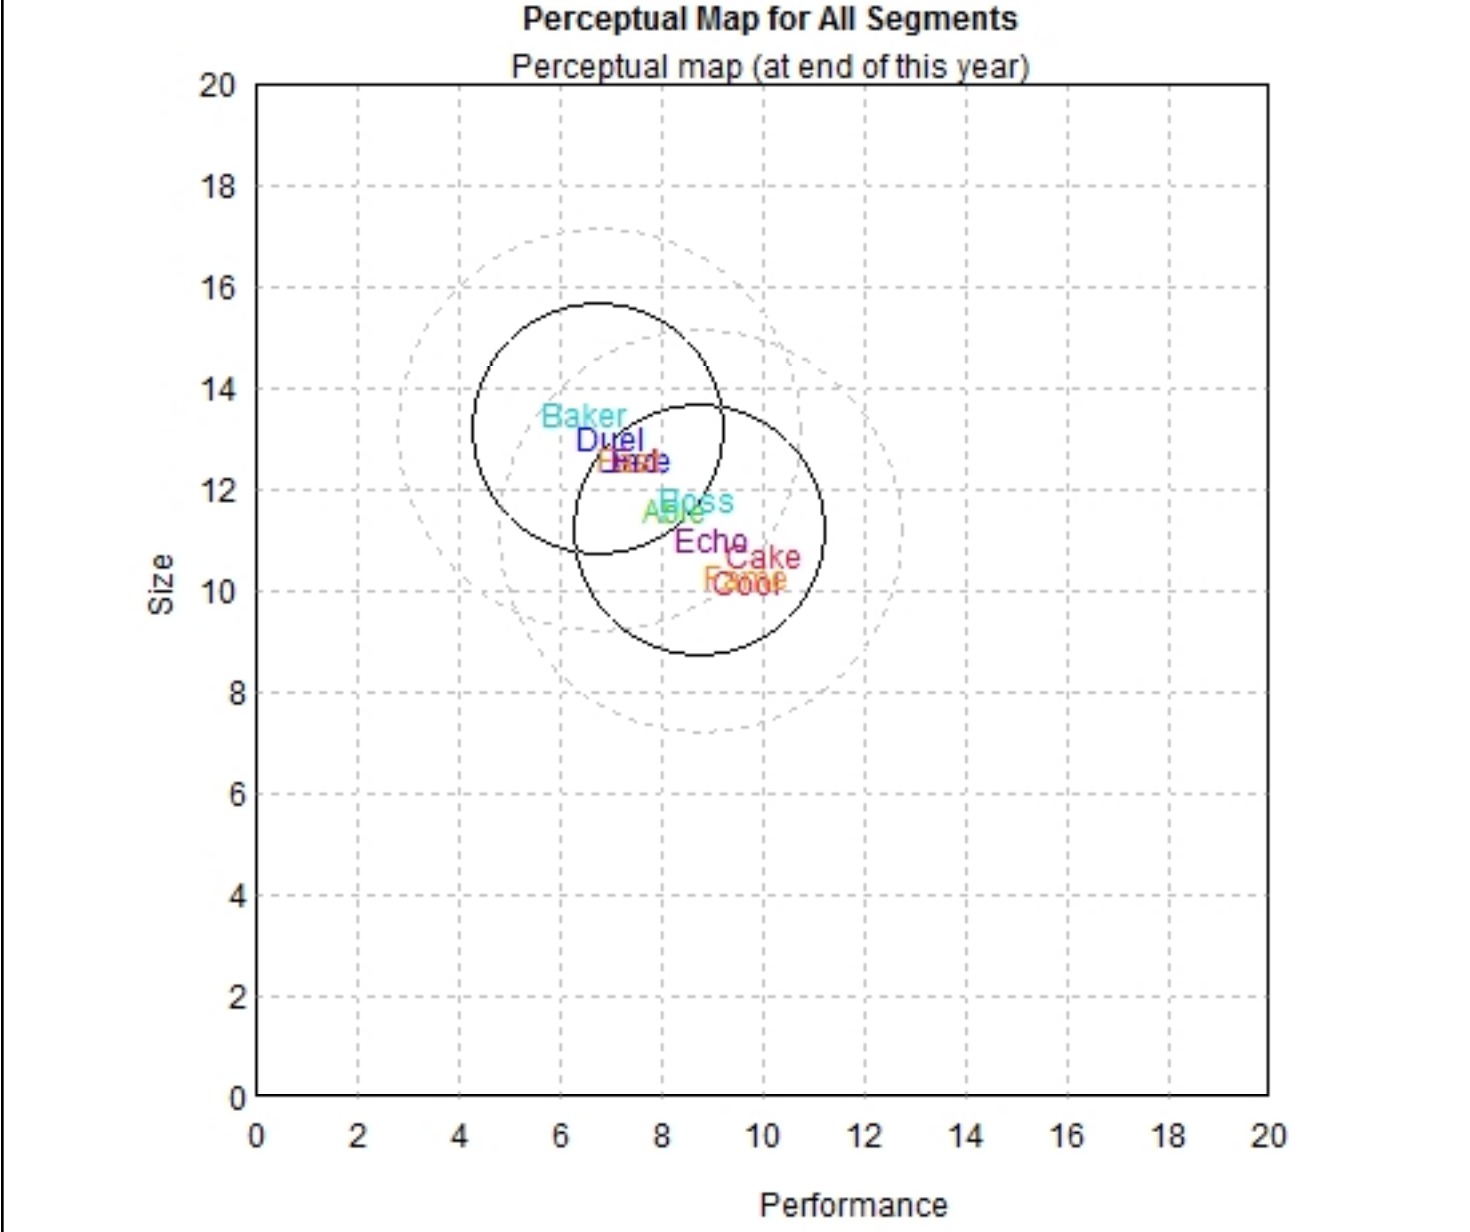
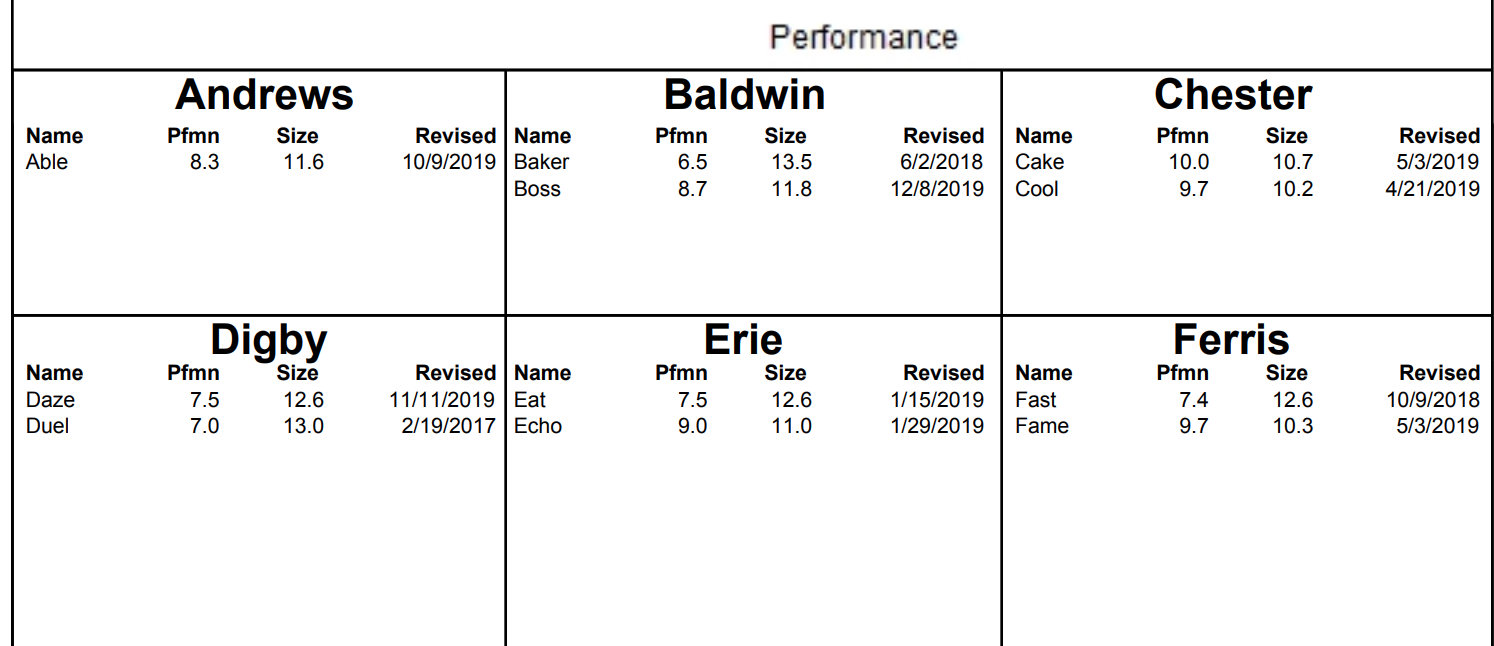
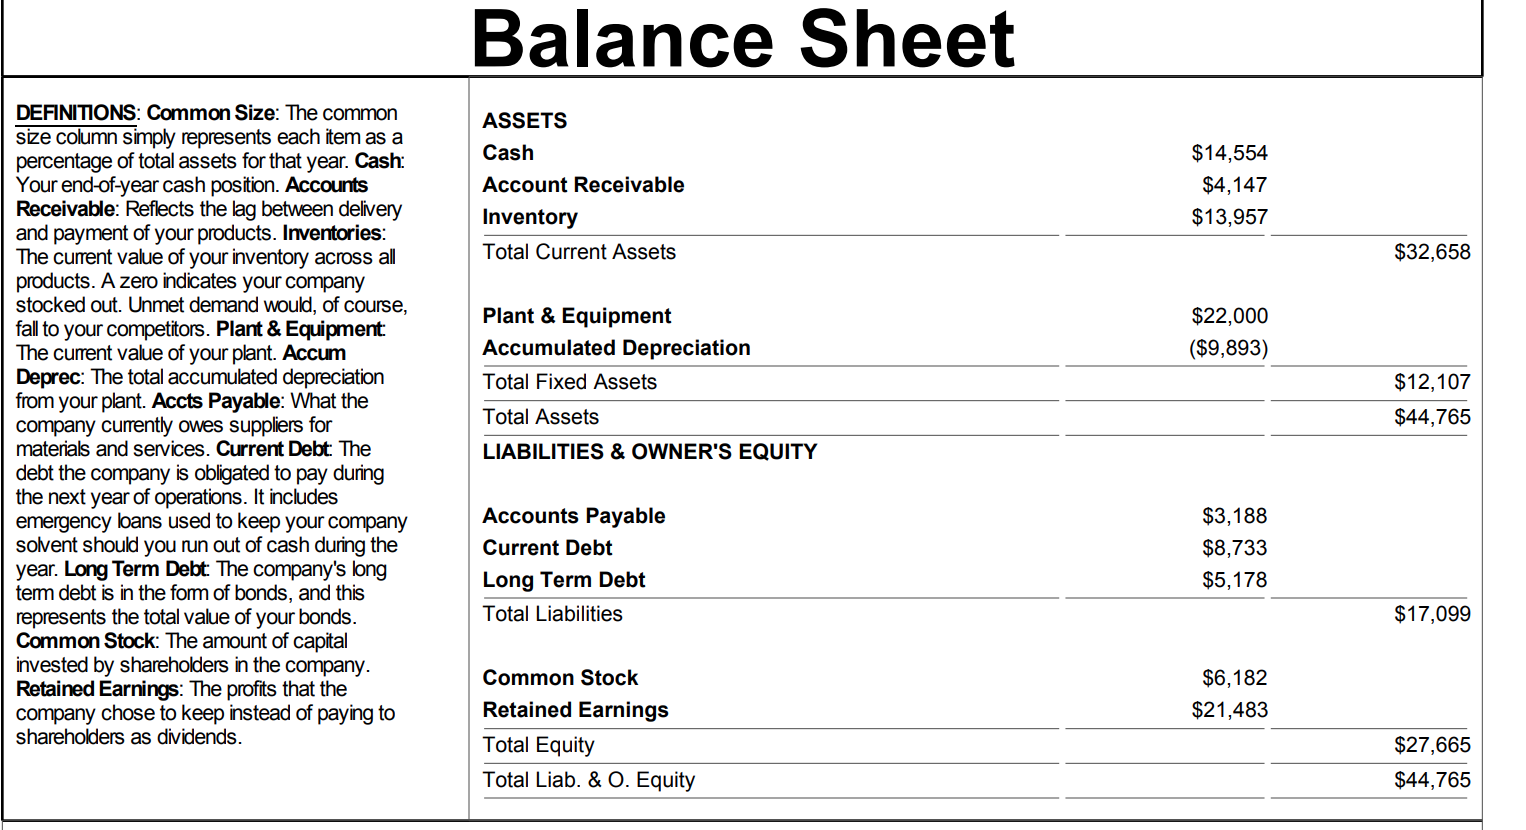
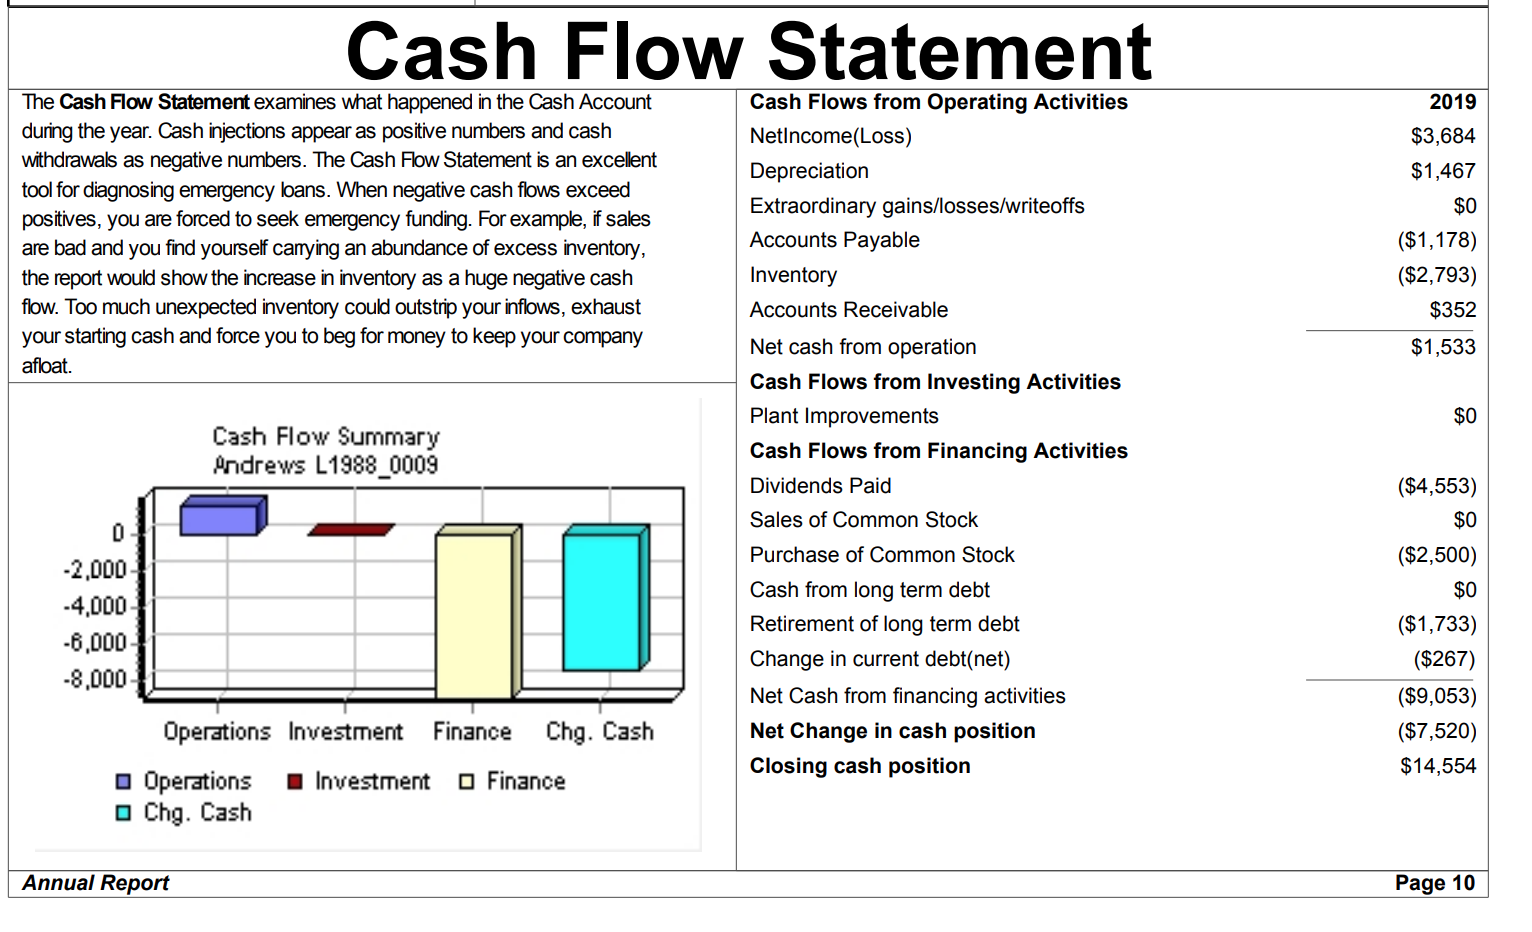
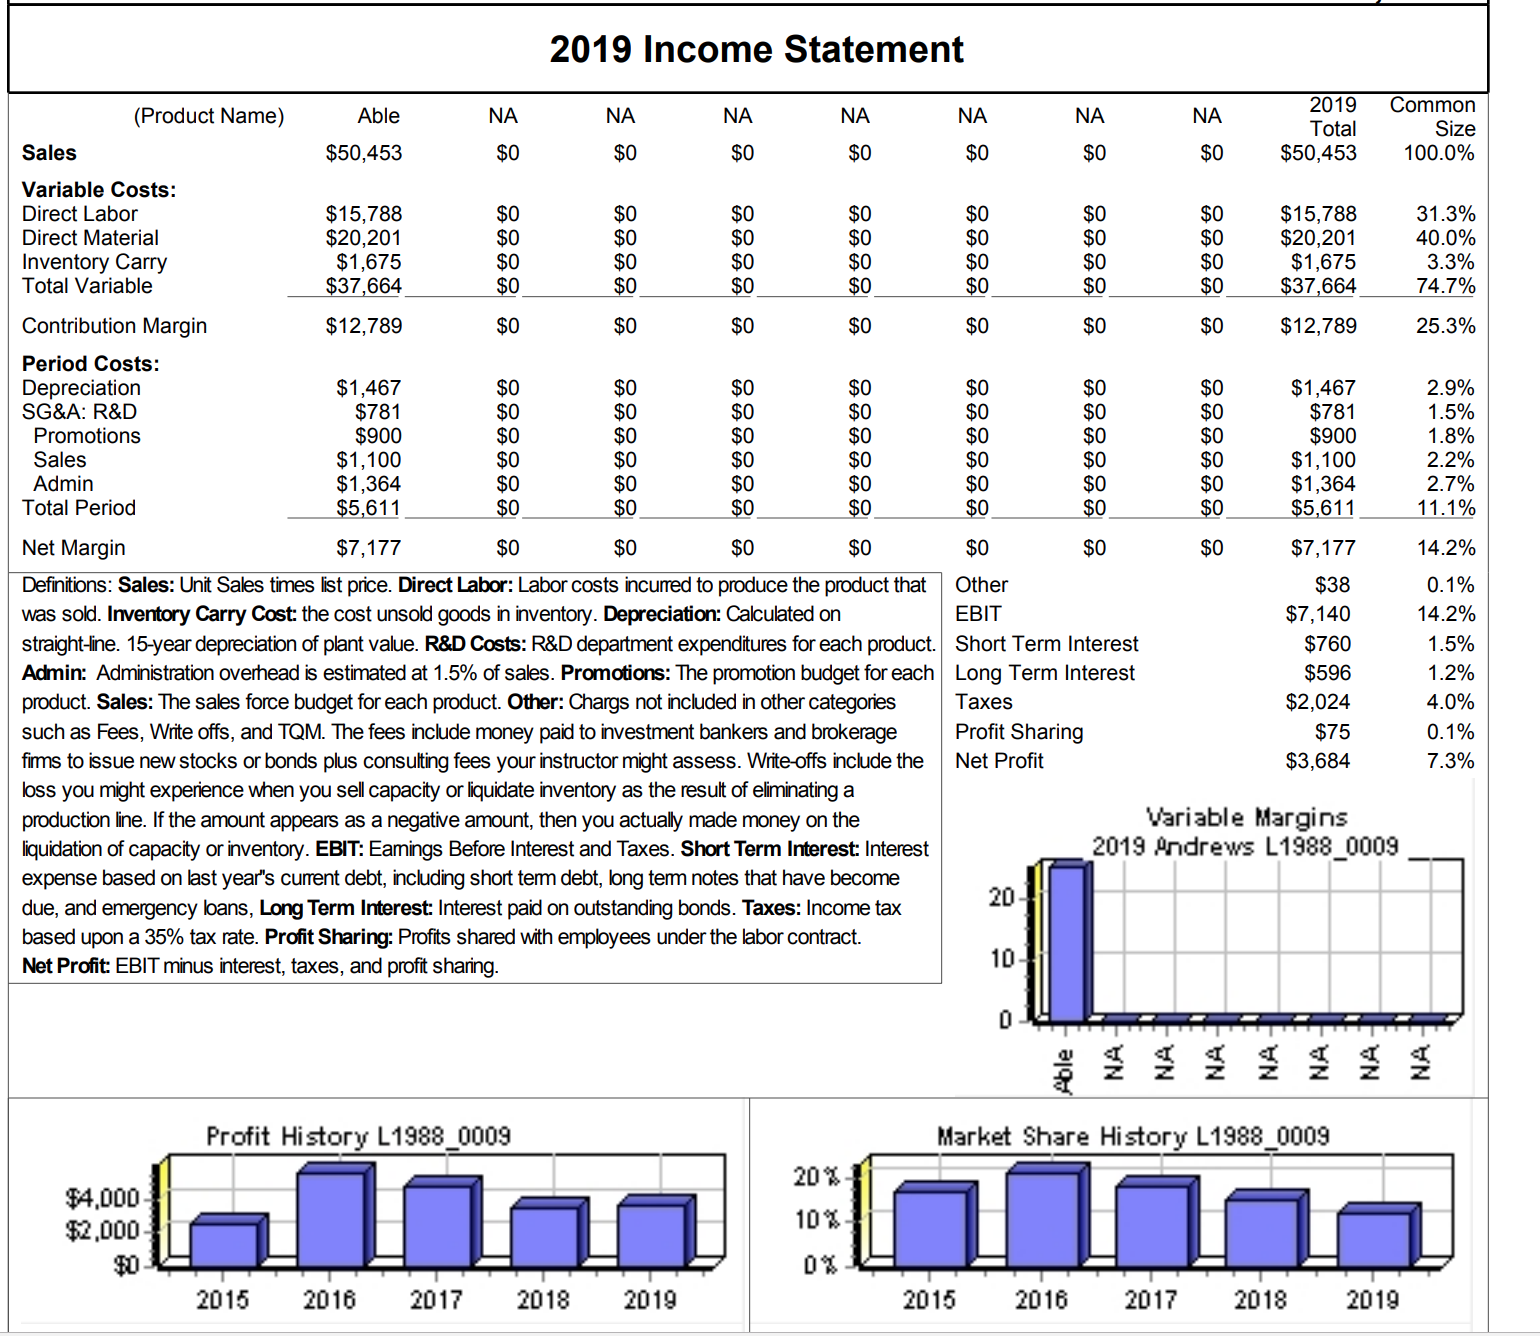
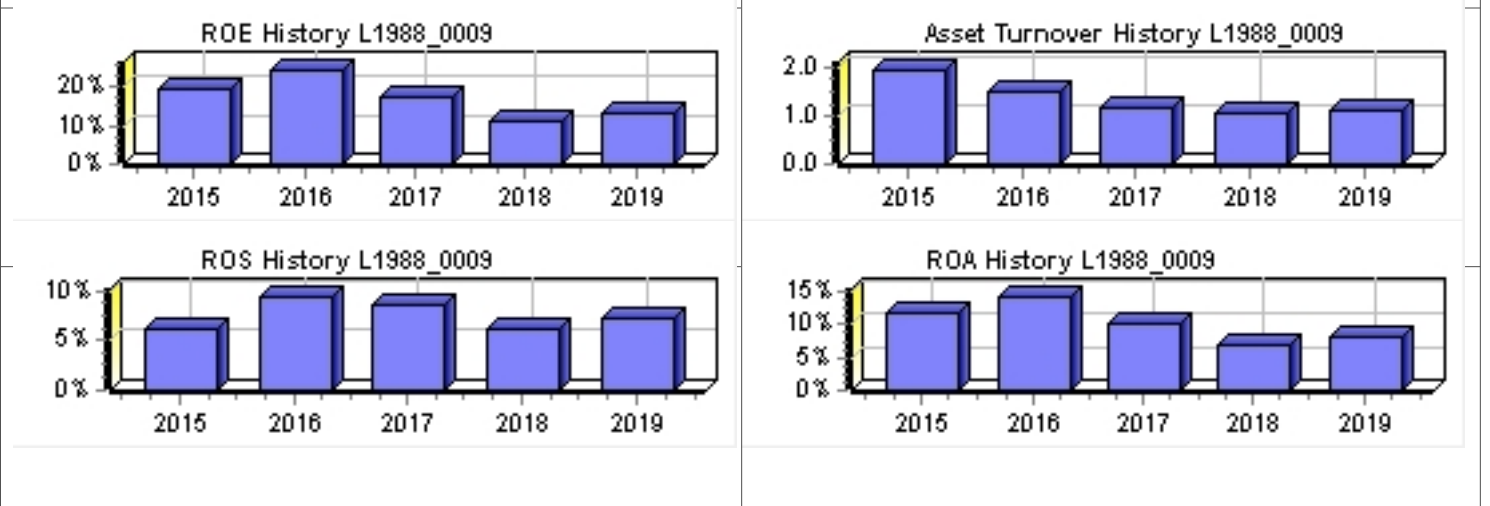
Selected Financial Statistics Andrews Baldwin Chester Digby Erie Ferris ROS 7.3% 14.3% 11.2% 12.3% 6.2% 8.6% Asset Turnover 1.13 1.16 1.72 1.28 1.07 1.42 ROA 8.2% 16.5% 19.2% 15.8% 6.7% 12.2% Leverage (Assets/Equity) 1.6 1.9 1.9 2.0 2.1 1.9 ROE 13.3% 31.7% 36.2% 31.7% 13.8% 22.8% Emergency Loan $0 $0 $0 $0 $0 Sales $50,452,659 $59,969, 146 $72,003,788 $93,975,976 $76,512,367 $64,874,289 EBIT $7, 139,975 $15,750,358 $14,363, 148 $21,430,879 $10,916, 128 $10,774,541 Profits $3,684,460 $8,547,854 $8,069, 187 $11,571,396 $4,763,428 $5,607,907 Cumulative Profit $0 $0 $0 $0 $0 $0 SG&A / Sales 8.2% 9.0% 8.1% 6.5% 7.2% 9.6% Contribargin % 25.3% 39.7% 30.7% 33.2% 26.2% 30.1% Percent of Sales L1988_0009 $ Market Share L1988_0009 100% 90 % - 0 Var Costs 80 % Depr 70% O SGA 60% Other 50% Profit 40% 30 % 0 Andrews 12.08 % Baldwin 14.35 % 20% O Chester 17.23 % 10% 0 Digby 22.49 % 0% Erie 18.31 % Andrews Baldwin Chester Digby Erie Ferris Femis 15.53 %Stock Market Summary Company Close Change Shares MarketCap Book Value EPS Yield P/E ($M) Dividend Andrews $21.52 $0.20 2,276,739 $49 $12.15 $1.62 $2.00 9.3% 13.3 Baldwin $30.22 $8.99 2,366,523 $72 $11.39 $3.61 $2.50 8.3% 8.4 Chester $32.15 $4.04 2,018,767 $65 $11.04 $4.00 $0.73 2.3% 8.0 Digby $42.16 $13.23 2,206,940 $93 $16.56 $5.24 $2.06 4.9% 8.0 Erie $26.50 $2.41 2,247,401 $60 $15.37 $2.12 $0.00 0.0% 12.5 Ferris $24.35 $4.33 2, 118,736 $52 $11.60 $2.65 $0.00 0.0% Closing Stock Price L1988_0009 $60 & Andrews $50 Baldwin Chester $40 Digby $30 Erie Femis $20 $10 2015 2016 2017 2018 2019 2020 2021 2022 2023 Bond Market Summary Company Series# Face Yield Close$ S&P Company Series# Face Yield Close$ S&P Andrews Digb 13.0S2021 $2,600,000 12.4% 105.21 BBB 13.0S2021 $2,600,000 12.6% 102.90 10.0S2026 $2,480,000 10.0% 100.00 BBB 10.0S2026 $2,455,212 10.6% 93.93 10.3S2027 $98,000 10.1% 101.60 BBB 11.1S2027 $4,051,266 11.2% 98.98 Baldwin 11.0S2028 $3,542,534 11.2% 98.36 13.0S2021 $2,600,000 12.6% 103.42 11.0S2029 $4,640,046 11.2% 98.25 w ww ww 10.0S2026 $2,361,878 10.5% 95.29 Erie 11.2S2027 $5,371,257 11.1% 101.03 13.0S2021 $2,600,000 12.7% 102.55 CCC 10.9S2028 $685,521 11.0% 99.45 10.0S2026 $2,367,945 10.7% 93.04 CCC 11.352029 $520,665 11.1% 101.77 10.7S2027 $3,011,838 11.2% 95.95 CCC Chester 11.452028 $3,669,617 11.5% 99.46 CCC 13.0S2021 $2,050,545 12.5% 103.60 BB 11.3S2029 $7,578,613 11.4% 98.85 CCC 10.0S2026 $2, 193,878 10.4% 95.75 BB Ferris 11.652029 $2,271,515 11.1% 104.14 BB 13.0S2021 $2,506,085 12.5% 103.60 BB 10.0S2026 $2,480,000 10.4% 95.75 BB 10.7S2027 $2,770, 178 10.8% 98.97 BB 11.652029 $2,631,275 11.1% 104.14 BBCash Flow Statement Survey Andrews Baldwin Chester Digby Erie Ferris CashFlows from operating activities Net Income(Loss $3,684 $8,548 $8,069 $11,571 $4,763 $5,608 Adjustment for non-cash items: Depreciation $1,467 $2,635 $1,800 $3,421 $3,007 $2,320 Extraordinary gains/losses/writeoffs $0 $0 $0 $0 $0 $0 Changes in current assets and liablilities Acounts payable ($1, 178) ($271) ($171) $1,482 $611 ($1,064) nventory ($2,793) ($1,707) $1,314 ($6,705 ($6, 146) $7,639 Accounts Receivable $352 ($648) ($1, 103) $1,556) ($463) ($801 ) Net cash from operations $1,533 $8,558 $9,910 $8,214 $1,772 $13,701 Cash flows from investing activities Plant improvements(net) $0 $0 ($6,300) ($10,760) ($15,900) ($6,480) Cash flows from financing activities Dividends paid ($4,553) ($5,907) ($1,476) ($4,552) $0 $0 Sales of common stock $0 $0 $0 $0 $4, 120 $872 Purchase of common stock ($2,500) $0 $0 $0 $0 $0 Cash from long term debt issued $0 $521 $2,272 $4,640 $7,579 $2,631 Early retirement of long term debt $0 $0 $0 $0 $0 $0 Retirement of current debt ($9,000) ($8, 190) $9,308) $7,893) ($7,948) ($8,775) Cash from current debt borrowing $7,000 $8,591 $9,277 $12, 143 $11,059 $7,799 Cash from emergency loar $0 $0 $0 $0 $0 $0 Net cash from financing activities ($9,053) ($4,985) $764 $4,338 $14,810 $2,527 Net change in cash position ($7,520) $3,572 $4,374 $1,792 $682 $9,748 Balance Sheet Survey Andrews Baldwin Chester Digby Erie Ferris Cash $14,554 $11,677 $10,754 $20,226 $13, 108 $11,391 Accounts Receivable $4, 147 $4,929 $5,918 $7,724 $6,289 $5,332 Inventory $13,957 $8,951 $8,699 $6,705 $9,370 $5,593 Total Current Assets $32,658 $25,557 $25,370 $34,656 $28,767 $22,316 Plant and equipment $22,000 $39,531 $27,000 $51,320 $55,500 $34,800 Accumulated Depreciation ($9,893) ($13,249) ($10,380) ($12,605) ($12,662) ($11,304) Total Fixed Assets $12, 107 $26,282 $16,620 $38,715 $42,838 $23,496 Total Assets $44,765 $51,839 $41,990 $73,371 $71,605 $45,812 Account Payable $3, 188 $3,023 $3,905 $5,648 $5,053 $3,045 CurrentDebt $8,733 $10,324 $9,277 $13,876 $12,792 $7,799 Long Term Debt $5, 178 $11,539 $6,516 $17,289 $19,228 $10,388 Total Liabilities $17,099 $24,886 $19,698 $36,814 $37,073 $21,232 Common Stock $6,182 $6,620 $2,533 $5,009 $7,511 $4,034 Retained Earnings $21,483 $20,333 $19,760 $31,548 $27,021 $20,546 Total Equity $27,665 $26,952 $22,292 $36,557 $34,532 $24,580Total Liabilities & Owners" Equity $44,765 $51,839 $41,990 $73,371 $71,605 $45,812 Income Statement Survey Andrews Baldwin Chester Digby Erie Sales Ferris $50,453 $59,969 $72,004 $93,976 Variable Costs(Labor, Material, Carry) $76,512 $64,874 $37,664 $36, 145 $49,874 $62,821 $56,458 Depreciation $45,360 $1,467 $2,635 $1,800 SGA(R&D, Promo, Sales, Admin) $3,421 $3,007 $2,320 $4, 144 $5,413 $5,853 $6,071 $5,547 $6,244 Other(Fees, Writeoffs, TQM, Bonuses) $38 $26 $114 $232 EBIT $585 $175 $7, 140 $15,750 $14,363 $21,431 Interest(Short term, Long term) $10,916 $10,775 $1,356 $2,331 $1,696 $3,265 $3,438 Taxes $1,971 $2,024 $4,697 $4,434 $6,358 Profit Sharing $2,617 $3,081 $75 $174 $165 $236 Net Profit $97 $114 $3,684 $8,548 $8,069 $11,571 $4,763 $5,608 FOUNDATION@ FAST TRACK Page 3Production Vs. Capacity L1988_0009 Andrews Baldwin Chester Digby Erie Ferris 200 400 600 800 1,000 1,200 1,400 1,600 1,800 2,000 2,200 2,400 2,600 2,800 3,000 3,200 Capacity O Production 2nd Shift Auto Unit & mation Capacity Primary Units Inven Age Pfmn Size Material Labor Contr. Over- Next Next Plant Name Segment Sold tory Revision Date Dec.31 MTBF Coord Coord Price Cost Cost Marg time Round Round Utiliz. Able Low 1,442 559 10/9/2019 2.0 21000 8.3 11.6 $35.00 $14.76 $10.63 25% 60% 4.0 1,000 158% Baker Low 1,148 367 6/2/2018 3.4 14000 6.5 13.5 $30.00 $9.06 $7.94 38% 10% 5.1 1,043 109% Boss Low 638 104 12/8/2019 0.9 19000 8.7 11.8 $40.00 $14.37 $9.88 42% 25% 4.0 600 124% Cake High 1,042 300 5/3/2019 1.6 23000 10.0 10.7 $44.00 $17.91 $11.05 32% 18% 3.0 850 116% Cool High 594 4/21/2019 1.4 23000 9.7 10.2 $44.00 $18.08 $12.77 29% 100% 3.0 650 198% Daze Low 1,425 258 11/1 1/2019 2.3 17000 7.5 12.6 $32.00 $11.81 $8.93 37% 100% 5.7 1, 150 198% Duel Low 1,512 72 2/19/2017 2.9 17000 7.0 13.0 $32.00 $10.94 $11.03 29% 88% 4.0 900 186% Eat Low 1, 161 418 1/15/2019 3.1 17000 7.5 12.6 $34.00 $11.81 $10.05 31% 32% 4.0 1,100 131% Echo High 1,089 0 O 1/29/2019 1.9 20000 9.0 11.0 $34.00 $15.73 $10.58 21% 57% 4.0 156% Edge 0 4/19/2020 0.0 0 0.0 0.0 $0.00 $0.00 $0.00 0% 0% 5.0 400 0% Fast Low 1,232 257 10/9/2018 4.2 18000 7.4 12.6 $34.00 $12.01 $9.02 34% 0% 4.0 1,050 85% Fame High 574 0 5/3/2019 1.3 23000 9.7 10.3 $40.00 $17.99 $12.76 22% 100% 3.0 650 198%Low Tech Statistics Total Industry Unit Demand 7,379 Actual Industry Unit Sales 7,379 Segment % of Total Industry 62.2% Next Year's Segment Growth Rate 10.0% Low Tech Customer Buying Criteria Expectations importance 1. Price $15.00 - 35.00 41% 2. Age Ideal Age = 3.0 29% 3. Reliability MTBF 14000-20000 21% 4. Ideal Position men 6.8 Size 13.2 9% PeroeptualllapforLowTech Percepmnwhtendoftiisyea) 68101214161820 Pefommoe Accessibility L1988_0009 Low Tech 801i. Actual us Potential Market Share 2019 L1988_0003 Low Tech ual I Potential Top Products in Low Tech Segment Units Cust. Cust. Dec. Market Sold to Revision Stock Pfmn Size List Age Promo Aware- Sales Access- Cust. Name Share Seg Date Out Coord Coord Price MTBF Dec.31 Budget ness Budget ibility Survey Daze 17% 1,275 11/1 1/2019 7.5 12.6 $32.00 17000 2.28 $800 57% $1,000 57% 17 Duel 17% 1,268 2/19/2017 7.0 13.0 $32.00 17000 2.86 $800 50% $1,000 57% 20 Able 15% 1,142 10/9/2019 8.3 11.6 $35.00 21000 2.04 $900 60% $1, 100 28% 13 Baker 15% 1,089 6/2/2018 6.5 13.5 $30.00 14000 3.43 $800 57% $1,000 43% 15 Fast 14% 1,030 10/9/2018 7.4 12.6 $34.00 18000 4.16 $1,000 63% $1,200 34% 13 Eat 13% 937 1/15/2019 7.5 12.6 $34.00 17000 3.09 $700 54% $900 40% 15 Boss 5% 333 12/8/2019 8.7 11.8 $40.00 19000 0.89 $750 45% $900 43% 3 Echo 4% 301 1/29/2019 YES 9.0 11.0 $34.00 20000 1.93 $700 47% $900 40% 8 Fame 0% 2 5/3/2019 YES 9.7 10.3 $40.00 23000 1.28 $1,000 47% $1,200 34% 0 Cake 0% 1 5/3/2019 10.0 10.7 $44.00 23000 1.59 $900 60% $1, 100 8% 0 FOUNDATION FAST TRACK Page 5High Tech Statistics Accessibility L1sss_ooos High Tech Total Industry Unit Demand 4,479 Actual Industry Unit Sales Segment % of Total Industry 37.8% Next Year's Segment Growth Rate 20.0% High Tech Customer Buying Criteria Expectations Importance 1. Ideal Position men 10.2 Size 9.8 33% 2. Age Ideal Age = 0.0 29% 3. Price $25.00 - 45.00 25% 4. Reliability MTBF 17000-23000 13% Perceptual ap for Him Tech Actual us Potential Marl-tel Share Perceptual map (at end of this year) 2019 L1sss_ooos . . . . High Tech Size 468101214161820 Palm Top Products in High Tech Segment Units Cust. Cust. Dec. Market Sold to Revision Stock Pfmn Size List Age Promo Aware- Sales Access- Cust. Name Share Seg Date Out Coord Coord Price MTBF Dec.31 Budget ness Budget ibility Survey Cake 23% 1,041 5/3/2019 10.0 10.7 $44.00 23000 1.59 $900 60% $1, 100 60% 25 Echo 18% 788 1/29/2019 YES 9.0 11.0 $34.00 20000 1.93 $700 47% $900 55% 18 Cool 13% 594 4/21/2019 YES 9.7 10.2 $44.00 23000 1.37 $900 53% $1, 100 60% 28 Fame 13% 572 5/3/2019 YES 9.7 10.3 $40.00 23000 1.28 $1,000 47% $1,200 56% 30 Boss 7% 305 12/8/2019 8.7 11.8 $40.00 19000 0.89 $750 45% $900 31% 12 Able 7% 299 10/9/2019 8.3 11.6 $35.00 21000 2.04 $900 60% $1, 100 28% 12 Duel 5% 244 2/19/2017 7.0 13.0 $32.00 17000 2.86 $800 50% $1,000 55% 5 Eat 5% 225 1/15/2019 7.5 12.6 $34.00 17000 3.09 $700 54% $900 55% 4 Fast 5% 203 10/9/2018 7.4 12.6 $34.00 18000 4.16 $1,000 63% $1,200 56% 5 Daze 3% 149 11/1 1/2019 7.5 12.6 $32.00 17000 2.28 $800 57% $1,000 55% Baker 1% 59 6/2/2018 6.5 13.5 $30.00 14000 3.43 $800 57% $1,000 31% FOUNDATION@ FAST TRACK Page 6Units Sold us Demand Chart L1338_0009 Market Share L1333_0009 6.000 4.000 2.000 g 5 '5 E o m 0 2 3 .9 '5 5 Lo H' h t' i 3 a \"' In lg & a: u I Industry Unit Sales I Total Unit Demand I Low I High Actual Market Share In Unlts Potentlal Market Share In Unlts Low High Total Low High Total Industry Unit Sales 7,379 4,479 11,353 Units Demanded 7,379 4.479 11,353 %of Market 62.2% 37.3% 100.0% %ofMarket 62.2% 37.3% 100.0% Able 15.5% 6.7% 12.2% Able 15.5% 5.1% 11.6% Total 15.5% 6.7% 12.2% Total 15.5% 5.1% 11.6% Baker 14.3% 1.3% 9.7% Baker 14.3% 1.0% 9.6% Boss 4.5% 6.8% 5.4% Boss 4.5% 5.2% 4.8% Total 19.3% 3.1% 15.1% Total 19.3% 6.3% 14.3% Cake 23.2% 3.3% Cake 17.7% 6.7% Cool 13.3% 5.0% Cool 20.0% 7.5% Total 36.5% 13.3% Total 37.6% 14.2% Daze 17.3% 3.3% 12.0% Daze 17.3% 2.6% 11.7% Duel 17.2% 5.4% 12.3% Duel 17.2% 4.2% 12.3% Total 34.5% 3.3% 24.3% Total 34.5% 6.7% 24.0% Eat 12.7% 5.0% 9.3% Eat 12.7% 3.3% 9.3% Echo 4.1% 17.3% 9.2% Echo 4.1% 15.9% 3.6% Total 16.3% 22.3% 19.0% Total 16.3% 19.3% 17.9% Fast 14.0% 4.5% 10.4% Fast 13.9% 3.5% 10.0% Fame 12.3% 4.3% Fame 21.1% 3.0% Total 14.0% 17.3% 15.2% Total 14.0% 24.5% 18.0% Perceptual Map for All Segments 20 Perceptual map (at end of this year) 18 16 14 Baker Duel. 12 ABoss Size 10 Echeake Cool 8 6 4 2 0 2 4 6 8 10 12 14 16 18 20 PerformancePerformance Andrews Baldwin Chester Name Pfmn Size Revised | Name Pfmn Size Revised Name Pfmn Size Revised Able 8.3 11.6 10/9/2019 Baker 6.5 13.5 6/2/2018 Cake 10.0 10.7 5/3/2019 Boss 8.7 11.8 12/8/2019 Cool 9.7 10.2 4/21/2019 Digby Erie Ferris Name Pfmn Size Revised | Name Pfmn Size Revised Name Pfmn Size Revised Daze 7.5 12.6 11/1 1/2019 Eat 7.5 12.6 1/15/2019 Fast 7.4 12.6 10/9/2018 Duel 7.0 13.0 2/19/2017 Echo 9.0 11.0 1/29/2019 Fame 9.7 10.3 5/3/2019HUMAN RESOURCES SUMMARY Needed Complement Andrews Baldwin Chester 269 Digby Complement 289 Erie 308 Ferris 269 498 429 289 308 263 1st Shift Complement 498 429 2nd Shift Complement 168 249 221 263 257 101 303 40 87 207 241 126 56 Overtime Percent Turnover Rate 0.1% 0.1% 0.0% 10.0% 0.0% New Employees 10.0% 0.0% 10.0% 0.0% 27 10.0% 10.0% Separated Employees 29 10.0% 31 116 187 79 26 Recruiting Spend 17 19 0 Training Hours $0 $0 0 101 0 $0 $0 $0 Productivity Index 0 0 $0 100.0% 100.0% 0 100.0% 0 100.0% 0 100.0% 100.0% Recruiting Cost Separation Cost $27 $29 $31 $187 $79 $95 $26 Training Cost $580 $85 $0 $0 $505 Total HR Admin Cost $0 $0 $0 $607 $1 14 $0 $0 $126 $0 $187 $79 $531 Strike DaysStrike Days TOM SUMMARY Process Mgt Budgets Last Year Andrews Baldwin Chester Digby Erie Ferris CPI Systems $0 Vendor/JIT $0 $0 $0 $0 $0 $0 $0 Quality Initiative Training $0 $0 $0 $0 Channel Support Systems $0 $0 $0 $0 $0 $0 $0 $0 Concurrent Engineering $0 $0 $0 $0 $0 $0 UNEP Green Programs $0 $0 $0 $0 $0 $0 $0 $0 $0 $0 TQM Budgets Last Year Benchmarking Quality Function Deployment Effort $0 $0 $0 $0 $0 $0 $0 $0 $0 CCE/6 Sigma Training $0 $0 $0 GEMI TQEM Sustainability Initiatives $0 $0 $0 $0 $0 Total Expenditures $0 $0 $0 $0 $0 $0 $0 $0 $0 $0 $0 $0 $0 Cumulative Impacts Material Cost Reduction 0.00% Labor Cost Reduction 0.00% 0.00% 0.00% 0.00% Reduction R&D Cycle Time 0.00% 0.00% 0.00% 0.00% 0.00% 0.00% 0.00% 0.00% 0.00% Reduction Admin Costs 0.00% 0.00% 0.00% 0.00% Demand Increase 0.00% 0.00% 0.00% 0.00% 0.00% 0.00% 0.00% 0.00% 0.00% 0.00% 0.00% 0.00%Balance Sheet DEFINITIONS: Common Size: The common size column simply represents each item as a ASSETS percentage of total assets for that year. Cash: Cash $14,554 Your end-of-year cash position. Accounts Account Receivable $4, 147 Receivable: Reflects the lag between delivery and payment of your products. Inventories: Inventory $13,957 The current value of your inventory across all Total Current Assets $32,658 products. A zero indicates your company stocked out. Unmet demand would, of course, fall to your competitors. Plant & Equipment: Plant & Equipment $22,000 The current value of your plant. Accum Accumulated Depreciation ($9,893) Depreci The total accumulated depreciation from your plant. Accts Payable: What the Total Fixed Assets $12, 107 company currently owes suppliers for Total Assets $44,765 materials and services. Current Debt: The LIABILITIES & OWNER'S EQUITY debt the company is obligated to pay during the next year of operations. It includes emergency loans used to keep your company Accounts Payable $3, 188 solvent should you run out of cash during the Current Debt $8,733 year. Long Term Debt: The company's long term debt is in the form of bonds, and this Long Term Debt $5, 178 represents the total value of your bonds. Total Liabilities $17,099 Common Stock: The amount of capital invested by shareholders in the company. Retained Earnings: The profits that the Common Stock $6, 182 company chose to keep instead of paying to Retained Earnings $21,483 shareholders as dividends. Total Equity $27,665 Total Liab. & O. Equity $44,765Cash Flow Statement The Cash Flow Statement examines what happened in the Cash Account Cash Flows from Operating Activities 2019 during the year. Cash injections appear as positive numbers and cash NetIncome(Loss) $3,684 withdrawals as negative numbers. The Cash Flow Statement is an excellent tool for diagnosing emergency loans. When negative cash flows exceed Depreciation $1,467 positives, you are forced to seek emergency funding. For example, if sales Extraordinary gains/losses/writeoffs $0 are bad and you find yourself carrying an abundance of excess inventory, Accounts Payable ($1, 178) the report would show the increase in inventory as a huge negative cash Inventory ($2,793) flow. Too much unexpected inventory could outstrip your inflows, exhaust Accounts Receivable $352 your starting cash and force you to beg for money to keep your company afloat. Net cash from operation $1,533 Cash Flows from Investing Activities Cash Flow Summary Plant Improvements $0 Andrews L1988_0009 Cash Flows from Financing Activities Dividends Paid ($4,553) D Sales of Common Stock -2,000- Purchase of Common Stock ($2,500) -4.000 Cash from long term debt $0 -6,000 Retirement of long term debt ($1,733) -8,000 Change in current debt(net) ($267) Net Cash from financing activities ($9,053) Operations Investment Finance Chg. Cash Net Change in cash position ($7,520) O Operations . Investment O Finance Closing cash position $14,554 O Chg. Cash Annual Report Page 102019 Income Statement 2019 Common (Product Name) Able NA NA NA NA NA NA NA Total Size Sales $50,453 $0 $0 $0 $0 $0 $0 $50,453 100.0% Variable Costs: Direct Labor $15,788 $20,201 $0 $0 $0 $0 So $15,788 31.3% $0 $0 $0 $0 $0 Direct Material $0 $0 $0 $0 $0 $20,201 40.0% Inventory Carry $1,675 $0 $0 $0 $0 $0 $0 $1,675 3.3% Total Variable $37,664 $0 $0 $0 $0 $0 $0 $0 $37,664 74.7% Contribution Margin $12,789 $0 $0 $0 $0 $0 $0 $0 $12,789 25.3% Period Costs: Depreciation $1,467 $0 $0 $0 $0 $0 $1,467 2.9% SG&A: R&D $781 $0 $0 $0 $0 $0 $0 $781 1.5% Promotions $900 $0 $0 $0 $0 $0 $900 1.8% Sales $1, 100 $0 $0 $0 $0 $0 $1, 100 2.2% Admin $1,364 $0 $0 $0 $0 $0 $0 $0 $0 $1,364 2.7% Total Period $5,611 $0 $0 $0 $0 $0 $0 $5,611 11.1% Net Margin $7, 177 $0 $0 $0 $0 $0 $0 $0 $7,177 14.2% Definitions: Sales: Unit Sales times list price. Direct Labor: Labor costs incurred to produce the product that Other $38 0.1% was sold. Inventory Carry Cost: the cost unsold goods in inventory. Depreciation: Calculated on EBIT $7, 140 14.2% straight-line. 15-year depreciation of plant value. R&D Costs: R&D department expenditures for each product. Short Term Interest $760 1.5% Admin: Administration overhead is estimated at 1.5% of sales. Promotions: The promotion budget for each | Long Term Interest $596 1.2% product. Sales: The sales force budget for each product. Other: Chargs not included in other categories Taxes $2,024 4.0% such as Fees, Write offs, and TQM. The fees include money paid to investment bankers and brokerage Profit Sharing $75 0. 1% firms to issue new stocks or bonds plus consulting fees your instructor might assess. Write-offs include the Net Profit $3,684 7.3% loss you might experience when you sell capacity or liquidate inventory as the result of eliminating a production line. If the amount appears as a negative amount, then you actually made money on the Variable Margins iquidation of capacity or inventory. EBIT: Eamings Before Interest and Taxes. Short Term Interest: Interest 2019 Andrews L1988_0009 expense based on last year's current debt, including short term debt, long term notes that have become due, and emergency loans, Long Term Interest: Interest paid on outstanding bonds. Taxes: Income tax 20 based upon a 35% tax rate. Profit Sharing: Profits shared with employees under the labor contract. Net Profit: EBIT minus interest, taxes, and profit sharing. 10 Able Profit History L1988_0009 Market Share History L1988_0009 20% $4.000 $2.000- 10 % 0% 2015 2016 2017 2018 2019 2015 2016 2017 2018 2019\f
Step by Step Solution
There are 3 Steps involved in it

Get step-by-step solutions from verified subject matter experts