

Question: I am working on a case study called TransGlobal Airlines. I need to find the breakeven per passenger for regional flight SOF - PLE. I
I am working on a case study called TransGlobal Airlines. I need to find the breakeven per passenger for regional flight SOF PLE. I have attached the income statement for that region as well as the necessary charts needed to help allocate. Right now, their average passenger per flight is and it needs to be in the high teens to I also need to find the breakeven ticket price. For fixed costs we only need to allocate Aircraft Depreciation, Pilot Crew, Cabin Crew, Gate Rental, & Ground Staff. The current price for a ticket is Kr b Breakeven volume of passengers for the SOF to PLE route.
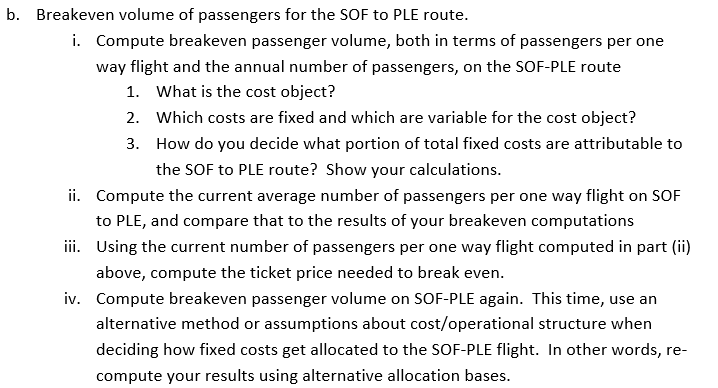
i Compute breakeven passenger volume, both in terms of passengers per one way flight and the annual number of passengers, on the SOFPLE route
What is the cost object?
Which costs are fixed and which are variable for the cost object?
How do you decide what portion of total fixed costs are attributable to the SOF to PLE route? Show your calculations.
ii Compute the current average number of passengers per one way flight on SOF to PLE, and compare that to the results of your breakeven computations
iii. Using the current number of passengers per one way flight computed in part ii above, compute the ticket price needed to break even.
iv Compute breakeven passenger volume on SOFPLE again. This time, use an alternative method or assumptions about costoperational structure when deciding how fixed costs get allocated to the SOFPLE flight. In other words, recompute your results using alternative allocation bases. begintabularlrr
hline multicolumnc INCOME STATEMENT for REGIONAL
hline & &
hline Revenues & &
hline Aircraft Costs & &
hline Fuel & &
hline Aircraft Depreciation & &
hline Flight Personnel Costs & &
hline Pilot Crew & &
hline Cabin Crew & &
hline Ground Costs & &
hline Gate Rental & &
hline Ground Staff & &
hline NET LOSS & & mathbf
hline
endtabular Table : TransGlobal Airlines
Daily Flight Schedule
ALL FLIGHTS OPERATE DAYS PER YEAR
begintabularccccccc
hline HOME CITY & DESTINATION & ONEWAY DISTANCE MILES & MARKET SEGMENT & EQUIPMENT &
ROUNDTRIP
FLIGHTS
PER DAY
& begintabularl
ANNUAL
PASSENGER
MILESFLOWN
MILLIONS
endtabular
hline multirowtSOF & CDG & & I & JJ & &
hline & FRA & & I & JJ & &
hline & IST & & I & JJ & &
hline & LHR & & I & JJ & &
hline & ROM & & I & J J & &
hline & WIN & & I & JJ & &
hline & BUR & & C & MJ & &
hline & PLO & & C & MJ & &
hline & RUS & & C & MJ & &
hline & VAR & & C & MJ & &
hline & BLA & & R & TP & &
hline & LOV & & R & TP & &
hline & PLE & & R & TP & &
hline & VLD & & R & TP & &
hline & VTA & & R & TP & &
hline multirowtPLO & VAR & & C & MJ & &
hline & GAB & & R & TP & &
hline & JAM & & R & TP & &
hline & KAR & & R & TP & &
hline & MAS & & R & TP & &
hline & SLI & & R & TP & &
hline & TAR & & R & TP & &
hline multirowtVAR & NES & & R & TP & &
hline & SIL & & R & TP & &
hline & SUM & & R & TP & &
hline & TOL & & R & TP & &
hline & & & & & &
hline
endtabular
mathrmI International, CLarge City, RRegional City JJJumbo Jet, MJMedium Jet, TPTurboprop Table : TransGlobal Airlines
Summary of Selected Cost and Operating Data
A crew flies one oneway intermational flight per day. Crews for the largecity routes fly one roundtrip flight per day. The regional crews fly three round trips per day. But crews dan't work every day, so there needs to be an allowance for holidass, sickness, and so an Thus the firm hives an equivalent of twice the number of crews needed per day. Table : TransGlobal Airlines
Summary of Selected Cost and Operating Data
Continued from previous page
Cabin crews put in the same amount of flight time as pilots.
Gates are dedicated to each type of aircraft. Thus there is no shaning of gates among the three market segments. There is one largecity gate at BUR, PIO, and RUS, and there are two largecity gates at VAR. Each regional city has one gate. There are three regionalcity gates at PLO and two at VAR
An informal time study shows that the staff at the primary hub spend of their time servicing international fights, on domestic largecity flights, and on regional fights. The staff at PLO spend of their time devoted to largecity fights and to regionalcrity flights. The staff at VAR spend of their time on largecity flights and an regional flights.
Step by Step Solution
There are 3 Steps involved in it
1 Expert Approved Answer
Step: 1 Unlock

Question Has Been Solved by an Expert!
Get step-by-step solutions from verified subject matter experts
Step: 2 Unlock
Step: 3 Unlock