

Question: I am working on a homework assignment. I did the calculations on SPSS and came up with the chart that I have attached. The question
I am working on a homework assignment. I did the calculations on SPSS and came up with the chart that I have attached. The question I have to answer is in bold. I want to say it is significant but I am not understanding how to explain this.
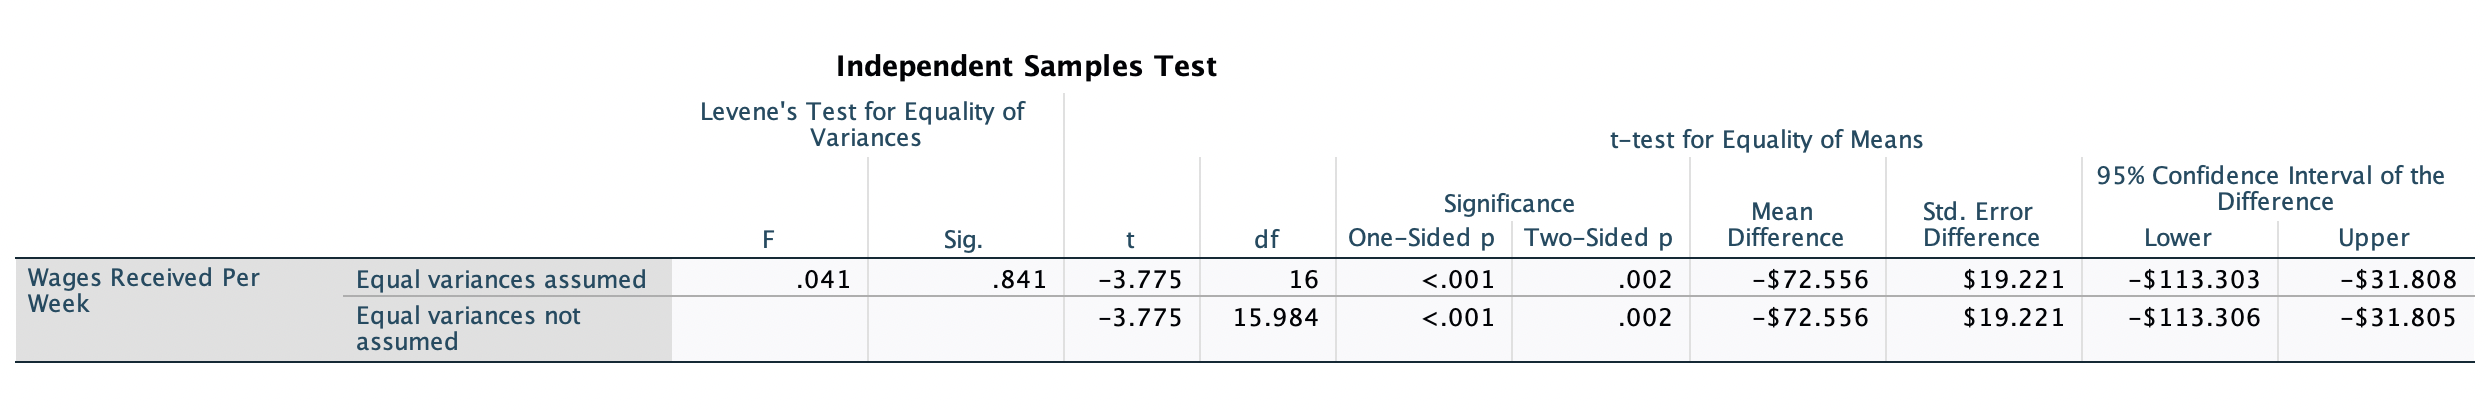
Independent Samples Test Levene's Test for Equality of Variances t-test for Equality of Means 95% Confidence Interval of the Significance Mean Std. Error Difference F Sig. df One-Sided p Two-Sided p Difference Difference Lower Upper Wages Received Per Equal variances assumed 041 .841 -3.775 16 <.001 .002 week equal variances not assumed>
Step by Step Solution
There are 3 Steps involved in it
1 Expert Approved Answer
Step: 1 Unlock

Question Has Been Solved by an Expert!
Get step-by-step solutions from verified subject matter experts
Step: 2 Unlock
Step: 3 Unlock