

Question: I am working on a project where I need to calculate the Seasonality and Capacity. I have attached the intructions that the professor emailed me.
I am working on a project where I need to calculate the "Seasonality" and "Capacity". I have attached the intructions that the professor emailed me. I have split up the demand for each year into quarters which are listed below. That is all I know how to do as of now. Any help is greatly appreciated.
Y1: Q1: 10,000 Q2: 12,000 Q3: 5,000 Q4: 10,000
Y2: Q1: 10,000 Q2: 6,000 Q3: 8,000 Q4: 14,000
Y3: Q1: 14,000 Q2: 10,000 Q3: 5,500 Q4: 10,000
Y4: Q1: 16,000 Q2: 8,000 Q3: 4,000 Q4: 12,500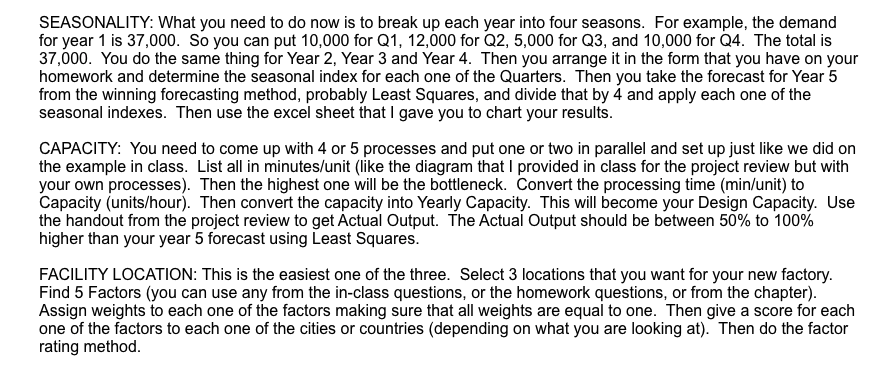
SEASONALITY: What you need to do now is to break up each year into four seasons. For example, the demand for year 1 is 37,000. So you can put 10,000 for Q1, 12,000 for Q2, 5,000 for Q3, and 10,000 for Q4. The total is 37,000. You do the same thing for Year 2, Year 3 and Year 4. Then you arrange it in the form that you have on your homework and determine the seasonal index for each one of the Quarters. Then you take the forecast for Year 5 from the winning forecasting method, probably Least Squares, and divide that by 4 and apply each one of the seasonal indexes. Then use the excel sheet that I gave you to chart your results. CAPACITY: You need to come up with 4 or 5 processes and put one or two in parallel and set up just like we did on the example in class. List all in minutes/unit (like the diagram that I provided in class for the project review but with your own processes). Then the highest one will be the bottleneck. Convert the processing time (min/unit) to Capacity (units/hour). Then convert the capacity into Yearly Capacity. This will become your Design Capacity. Use the handout from the project review to get Actual Output. The Actual Output should be between 50% to 100% higher than your year 5 forecast using Least Squares. FACILITY LOCATION: This is the easiest one of the three. Select 3 locations that you want for your new factory. Find 5 Factors (you can use any from the in-class questions, or the homework questions, or from the chapter). Assign weights to each one of the factors making sure that all weights are equal to one. Then give a score for each one of the factors to each one of the cities or countries (depending on what you are looking at). Then do the factor rating method. SEASONALITY: What you need to do now is to break up each year into four seasons. For example, the demand for year 1 is 37,000. So you can put 10,000 for Q1, 12,000 for Q2, 5,000 for Q3, and 10,000 for Q4. The total is 37,000. You do the same thing for Year 2, Year 3 and Year 4. Then you arrange it in the form that you have on your homework and determine the seasonal index for each one of the Quarters. Then you take the forecast for Year 5 from the winning forecasting method, probably Least Squares, and divide that by 4 and apply each one of the seasonal indexes. Then use the excel sheet that I gave you to chart your results. CAPACITY: You need to come up with 4 or 5 processes and put one or two in parallel and set up just like we did on the example in class. List all in minutes/unit (like the diagram that I provided in class for the project review but with your own processes). Then the highest one will be the bottleneck. Convert the processing time (min/unit) to Capacity (units/hour). Then convert the capacity into Yearly Capacity. This will become your Design Capacity. Use the handout from the project review to get Actual Output. The Actual Output should be between 50% to 100% higher than your year 5 forecast using Least Squares. FACILITY LOCATION: This is the easiest one of the three. Select 3 locations that you want for your new factory. Find 5 Factors (you can use any from the in-class questions, or the homework questions, or from the chapter). Assign weights to each one of the factors making sure that all weights are equal to one. Then give a score for each one of the factors to each one of the cities or countries (depending on what you are looking at). Then do the factor rating method
Step by Step Solution
There are 3 Steps involved in it

Get step-by-step solutions from verified subject matter experts