

Question: I am working on a stats problem and I can't tell if I have 99 degrees of freedom or 49. I have 100 participants divided
I am working on a stats problem and I can't tell if I have 99 degrees of freedom or 49. I have 100 participants divided up I to 2 groups of 50 children and 50 adults. I plugged in this two tailed test into r studio and am getting 84.66 dfs. I don't understand how. I am comparing 2 means
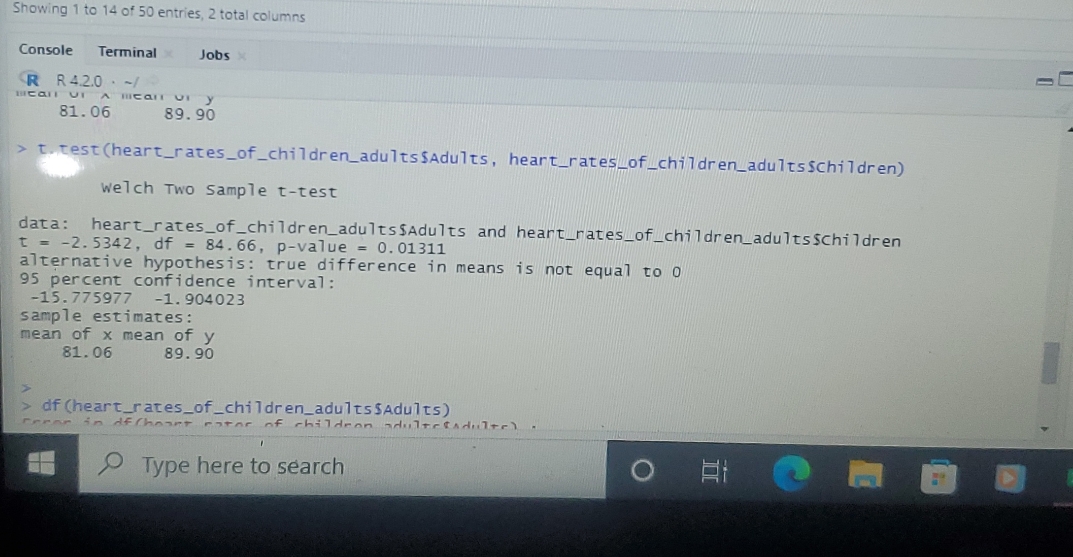
Showing 1 to 14 of 50 entries, 2 total columns Console Terminal Jobs R R420 . -/ HICall VI A mean UI y 81. 06 89. 90 > t. test (heart_rates_of_children_adults$Adults, heart_rates_of_children_adults Schildren) Welch Two Sample t-test data: heart_rates_of_children_adultsSAdults and heart_rates_of_children_adults$children t = -2. 5342, df = 84. 66, p-value = 0. 01311 alternative hypothesis: true difference in means is not equal to 0 95 percent confidence interval: -15.775977 -1. 904023 sample estimates : mean of x mean of y 81. 06 89. 90 > of (heart_rates_of_children_adults SAdults) Feror in offhaast motor of children gluleetsdalery Type here to search O D
Step by Step Solution
There are 3 Steps involved in it

Get step-by-step solutions from verified subject matter experts