Question: I am working on this simulation problem and I have already solved the first part of it. But I am confused on how to solve
I am working on this simulation problem and I have already solved the first part of it. But I am confused on how to solve number two. As I said I have already done number 1 a-d. I am just confused on how to set up the normal distribution for number 2. If someone could help me with this that would be great. Below I attached the problem and my current excel spreadsheet. I also included a formulated view version of my spreadsheet.
Problem:
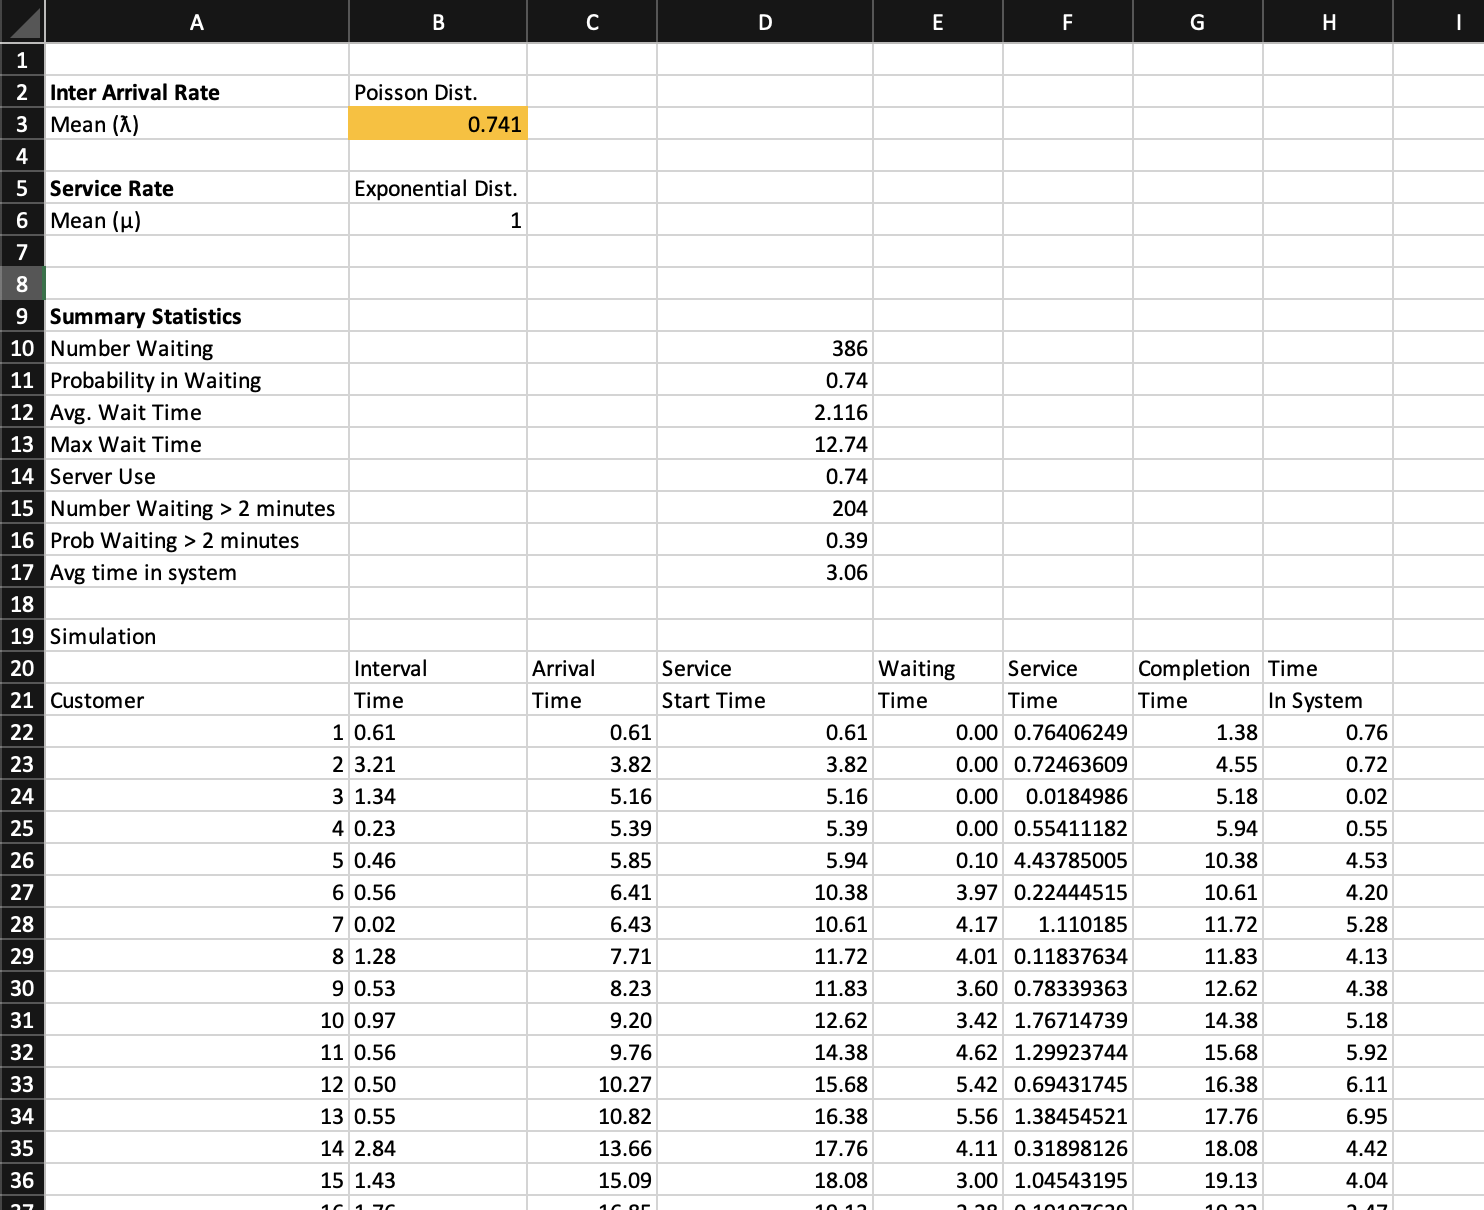
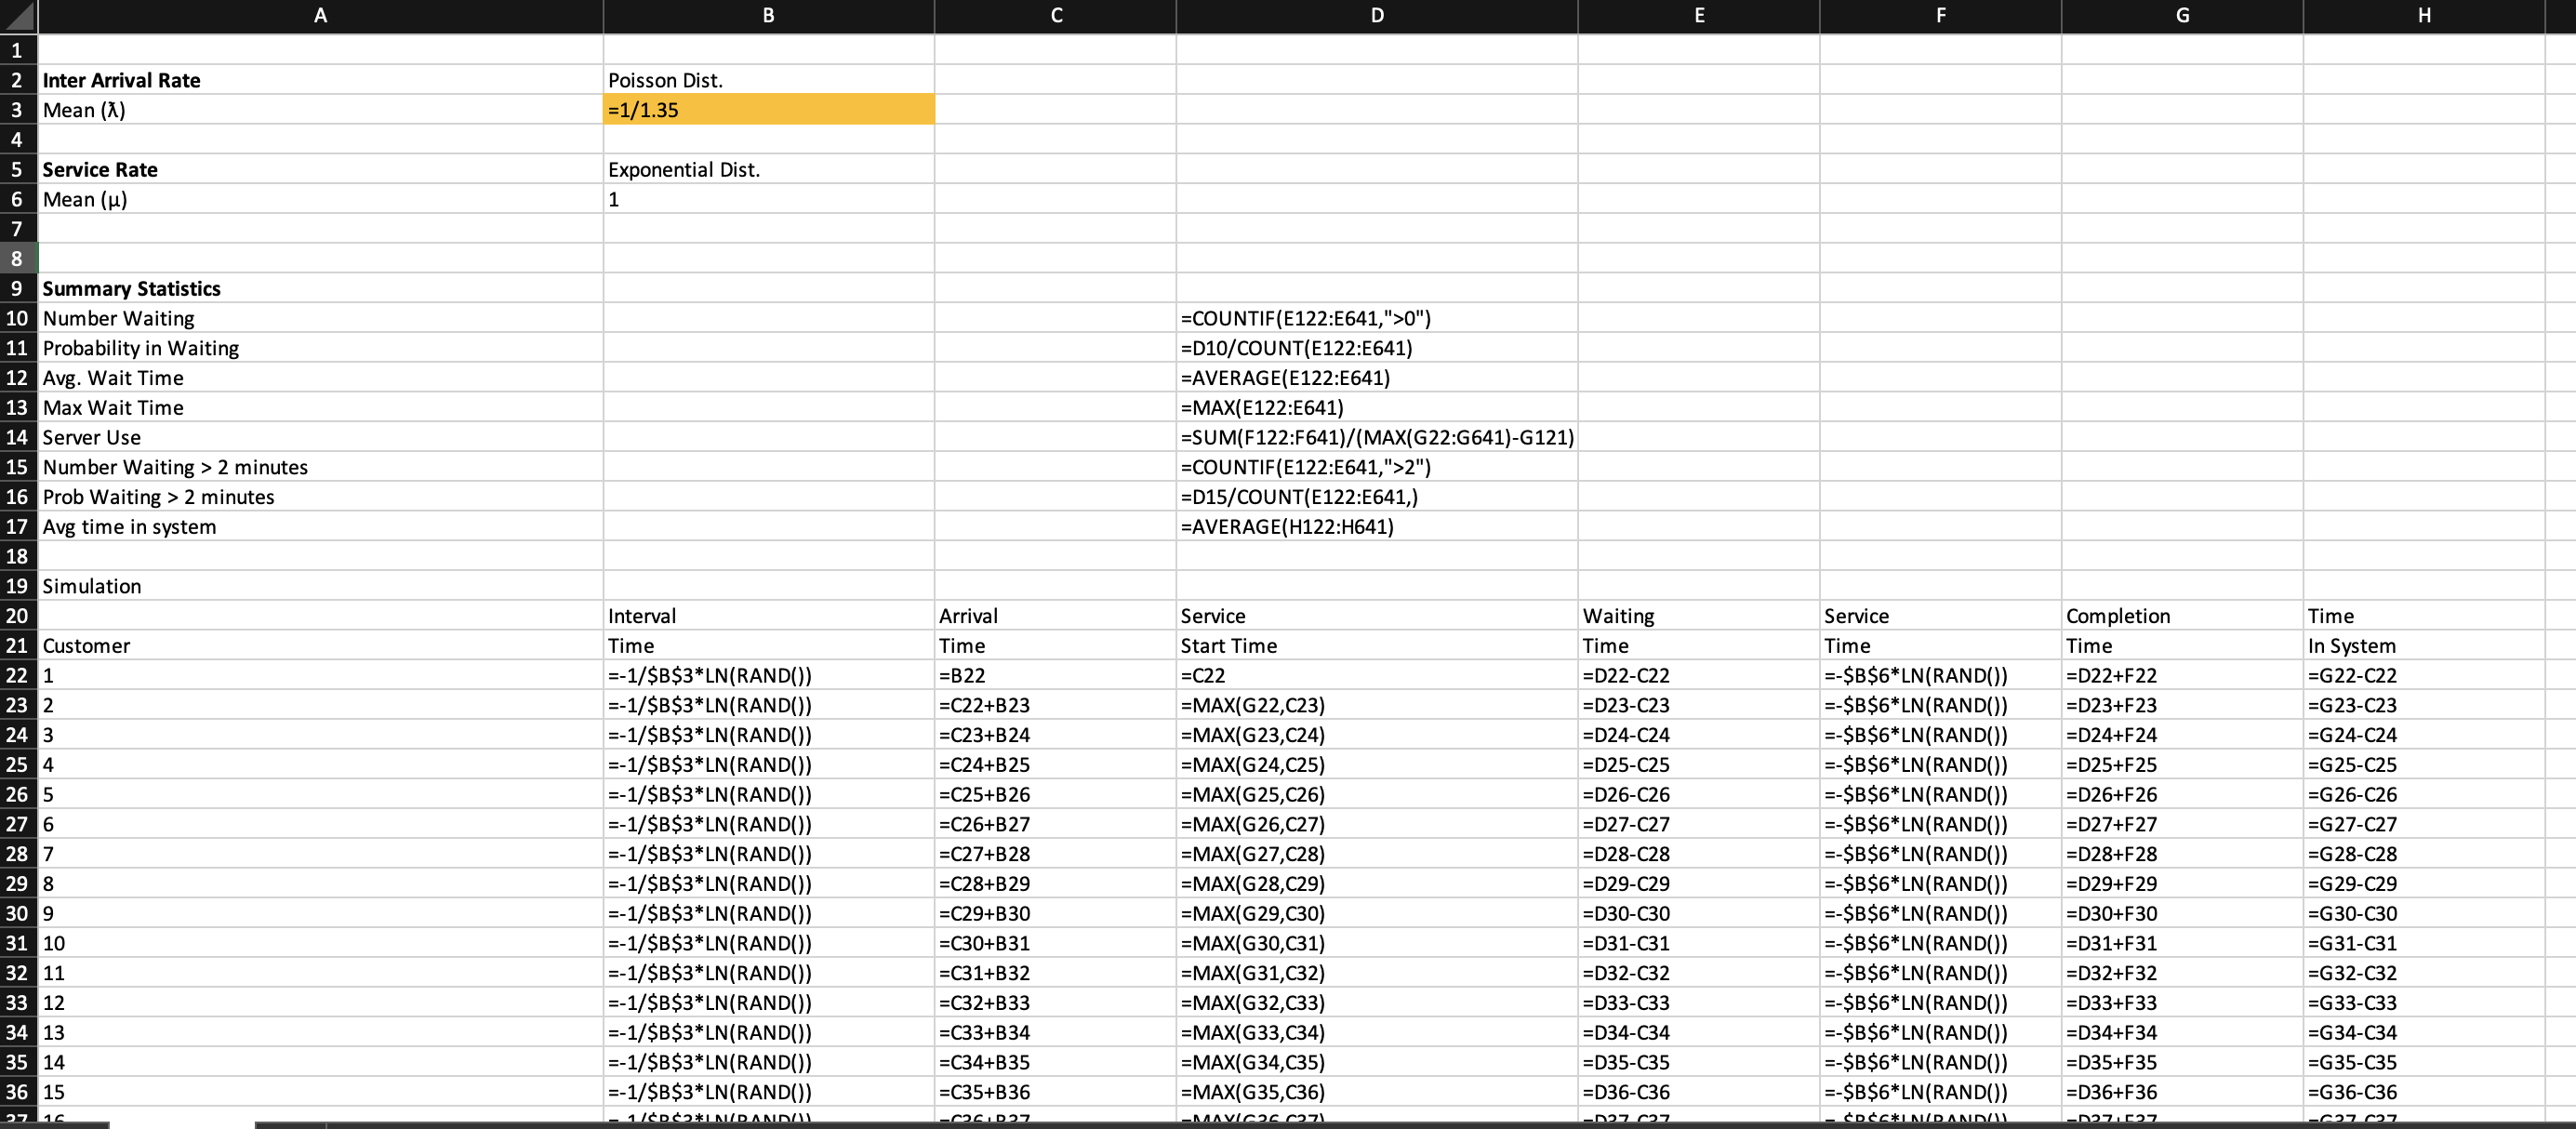
Burger Dome is a fast-food restaurant currently evaluating its customer service. In its current operation, an employee takes a customer's order, tabulates the cost, receives the payment from the customer, and then lls the order. Once the customer's order is lled, the employee takes the order of the next customer waiting for service. Assume that time between each customer's arrival is an exponential random variable with a mean of 1.35 minutes. Assume that the time for the employee to complete the customer's service is an exponential random variable with a mean of 1 minute. Develop a model for the waiting line at Burger Dome for a 14-hour workday and answer the following: 1. a. What is the average wait time experienced by a customer? b. What is the longest wait time experienced by a customer? c. What is the probability that a customer waits more than 2 minutes? d. Create a histogram depicting the wait time distribution. 2. Assume that the service time is more accurately described by a normal distribution with a mean of 1 minutes and a standard deviation of 0.2 minutes. What is the impact of this change on the output measures? A B C D E F G H IN Inter Arrival Rate Poisson Dist. 3 Mean (1) 0.741 5 Service Rate Exponential Dist. 6 Mean (H) 1 9 Summary Statistics 10 Number Waiting 386 11 Probability in Waiting 0.74 12 Avg. Wait Time 2.116 13 Max Wait Time 12.74 14 Server Use 0.74 15 Number Waiting > 2 minutes 204 16 Prob Waiting > 2 minutes 0.39 17 Avg time in system 3.06 18 19 Simulation 20 Interval Arrival Service Waiting Service Completion Time 21 Customer Time Time Start Time Time Time Time In System 22 1 0.61 0.61 0.61 0.00 0.76406249 1.38 0.76 23 2 3.21 3.82 3.82 0.00 0.72463609 4.55 0.72 24 3 1.34 5.16 5.16 0.00 0.0184986 5.18 0.02 25 4 0.23 5.39 5.39 0.00 0.55411182 5.94 0.55 26 5 0.46 5.85 5.94 0.10 4.43785005 10.38 4.53 27 6 0.56 6.41 10.38 3.97 0.22444515 10.61 4.20 28 7 0.02 6.43 10.61 4.17 1.110185 11.72 5.28 29 8 1.28 7.71 11.72 4.01 0.11837634 11.83 4.13 30 9 0.53 8.23 11.83 3.60 0.78339363 12.62 4.38 31 10 0.97 9.20 12.62 3.42 1.76714739 14.38 5.18 32 11 0.56 9.76 14.38 4.62 1.29923744 15.68 5.92 33 12 0.50 10.27 15.68 5.42 0.69431745 16.38 6.11 34 13 0.55 10.82 16.38 5.56 1.38454521 17.76 6.95 35 14 2.84 13.66 17.76 4.11 0.31898126 18.08 4.42 36 15 1.43 15.09 18.08 3.00 1.04543195 19.13 4.04B D E G H 2 Inter Arrival Rate Poisson Dist. 3 Mean (A) =1/1.35 5 Service Rate Exponential Dist. 6 Mean (M) 1 8 9 Summary Statistics 10 Number Waiting =COUNTIF(E122:E641,">0") 11 Probability in Waiting =D10/COUNT(E122:E641) 12 Avg. Wait Time =AVERAGE(E122:E641) 13 Max Wait Time =MAX(E122:E641) 14 Server Use =SUM(F122:F641)/(MAX(G22:G641)-G121) 15 Number Waiting > 2 minutes =COUNTIF(E122:E641,">2") 16 Prob Waiting > 2 minutes =D15/COUNT(E122:E641,) 17 Avg time in system =AVERAGE(H122:H641) 18 19 Simulation 20 Interval Arrival Service Waiting Service Completion Time 21 Customer Time Time Start Time Time Time Time In System 22 =-1/$B$3*LN(RAND()) =B22 =C22 =D22-C22 =-$B$6*LN(RAND()) =D22+F22 =G22-C22 23 2 =-1/$B$3*LN(RAND()) =C22+B23 =MAX(G22,C23) =D23-C23 =-$B$6*LN(RAND()) =D23+F23 G23-C23 24 3 =-1/$B$3*LN(RAND()) =C23+B24 =MAX(G23,C24) =D24-C24 =-$B$6*LN(RAND()) =D24+F24 =G24-C24 25 =-1/$B$3*LN(RAND()) =C24+B25 =MAX(G24, C25) =D25-C25 -$B$6*LN(RAND()) =D25+F25 =G25-C25 26 =-1/$B$3*LN(RAND()) =C25+B26 =MAX(G25,C26 =D26-C26 =-$B$6*LN(RAND()) =D26+F26 =G26-C26 27 6 =-1/$B$3*LN(RAND() =C26+B27 =MAX(G26,C27) =D27-C27 =-$B$6*LN(RAND()) =D27+F27 =G27-C27 28 7 =-1/$B$3*LN(RAND()) =C27+B28 =MAX(G27, C28) =D28-C28 -$B$6*LN(RAND()) =D28+F28 =G28-C28 29 8 =-1/$B$3*LN(RAND()) =C28+B29 =MAX(G28, C29) =D29-C29 =-$B$6*LN(RAND()) =D29+F29 =G29-C29 30 9 =-1/$B$3*LN(RAND()) =C29+B30 =MAX(G29,C30) =D30-C30 -$B$6*LN(RAND()) =D30+F30 =G30-C30 31 10 =-1/$B$3*LN(RAND()) =C30+B31 =MAX(G30,C31 =D31-C31 =-$B$6*LN(RAND()) =D31+F31 =G31-C31 32 11 =-1/$B$3*LN(RAND()) =C31+B32 =MAX(G31,C32) =D32-C32 =-$B$6*LN(RAND()) =D32+F32 =G32-C32 33 12 =-1/$B$3*LN(RAND()) =C32+B33 =MAX(G32, C33) =D33-C33 =-$B$6*LN(RAND()) =D33+F33 =G33-C33 34 13 =-1/$B$3*LN(RAND()) =C33+B34 =MAX(G33,C34) =D34-C34 =-$B$6*LN(RAND()) =D34+F34 =G34-C34 35 14 =-1/$B$3*LN(RAND()) =C34+B35 =MAX(G34, C35) =D35-C35 =-$B$6*LN(RAND()) =D35+F35 =G35-C35 36 15 =-1/$B$3*LN(RAND()) =C35+B36 =MAX(G35,C36) =D36-C36 =-$B$6*LN(RAND()) =D36+F36 =G36-C36 1/CDC2*IN/DAND/LI MAVICOC -D27 027 CDCC*IN/RANDALL -D271527 627 027
Step by Step Solution
There are 3 Steps involved in it
1 Expert Approved Answer
Step: 1 Unlock
Question Has Been Solved by an Expert!
Get step-by-step solutions from verified subject matter experts
Step: 2 Unlock
Step: 3 Unlock
Students Have Also Explored These Related General Management Questions!