

Question: I am working with r studio trying to make a bar graph to show if there is a correlation between 2 of my variables. My
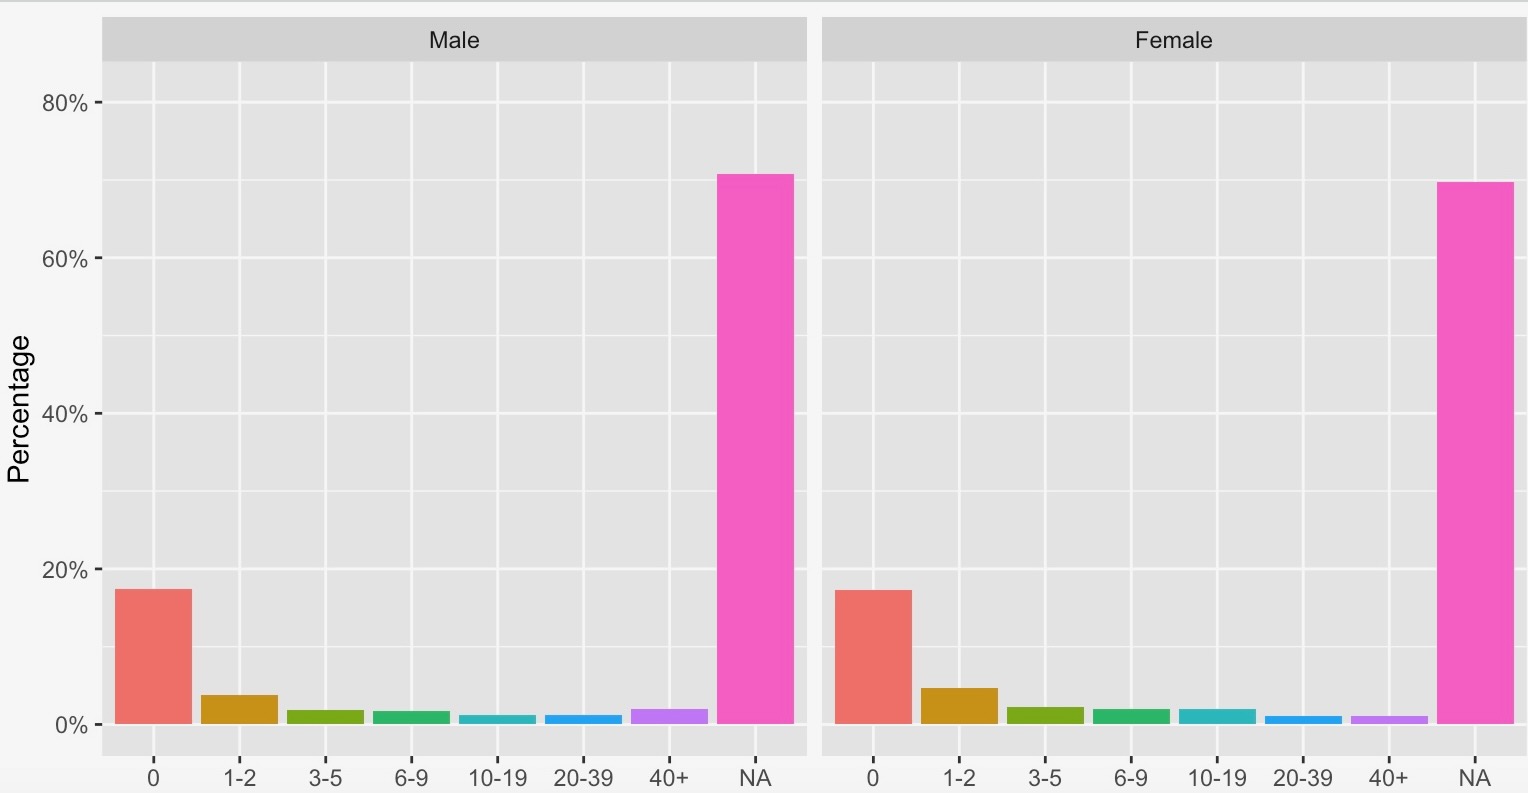
I am working with r studio trying to make a bar graph to show if there is a correlation between of my variables. My code works but my graph has NA values on it How can I remove the NA values? The data name is Final and my variables are Drink and Gender.
My code:
myplot ggplotFinal aesDrink group Gender
geombaraesy prop.., fill factorx stat"count"
scaleycontinuouslabelsscales::percent
ylabPercentage
facetgrid~Gender
Step by Step Solution
There are 3 Steps involved in it
1 Expert Approved Answer
Step: 1 Unlock

Question Has Been Solved by an Expert!
Get step-by-step solutions from verified subject matter experts
Step: 2 Unlock
Step: 3 Unlock