

Question: I asked for help plotting a function in python 2.7.12 and got an answer but it wasn't exaclty what I asked, so I'll try to
I asked for help plotting a function in python 2.7.12 and got an answer but it wasn't exaclty what I asked, so I'll try to clarify! I need to plot out this function:
 where m is 11, j runs from1 to m-1. I need to be able to input values of a0,a1,a2,...,a10 before the sum is carried out, and then I would like to be able to plot out that graph. The answer I got looks like it just plots the function evaluated at the ai and not summing the values, but the function should look like a combination of cosine waves. Here is the script they wrote, can someone revise it to better fit what I'm trying to do? I've also attached a little scratch work showing the expansion of what I want to plot if we let m = 3 instead. Thank you!
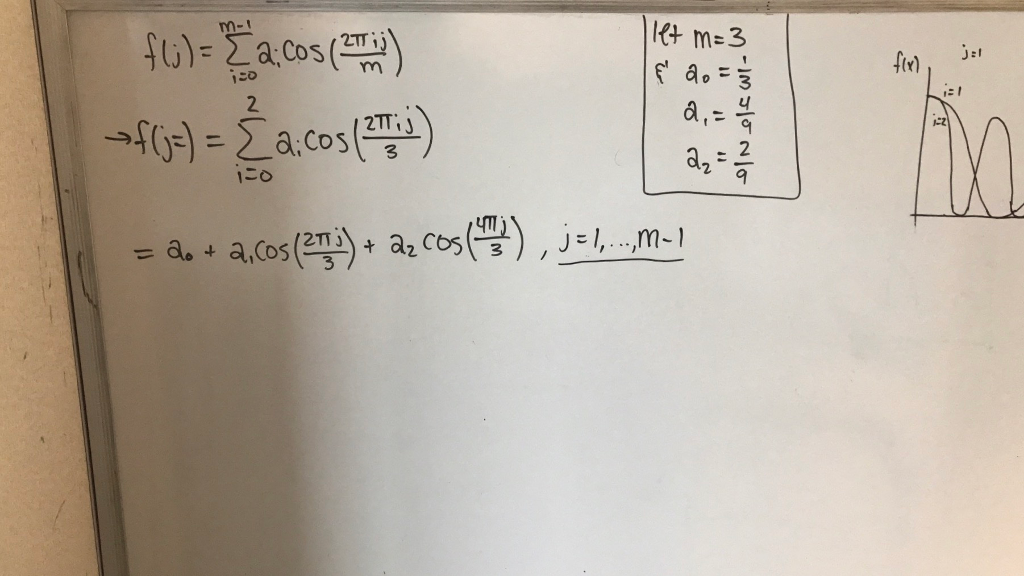
# Plotting a graph import matplotlib.pyplot as plt import numpy as np
m = 11 # definig m = 11 as given j = np.arange(1, m+1) # Giving j range from 1 to m+1 equally a = [] # list to store a0,a1,a2..a10 valuess result = [] # list to store result of cos funcion result
for i in range(0,m): # Getting a0..a10 values from input ai = input("Enter a" + str(i) + " value :-\t") a.append(ai)
for i in range (0,m): # Getting result value value = a[i] * np.cos(2*np.pi*i*j[i]/m) result.append(value)
plt.plot(j, result) # plotting j and f(j) plt.xlabel('j') plt.ylabel('f(j)') plt.title('Graph') plt.grid(True) #plt.savefig("result.png") plt.show() # showing plot
m-1 ai cos(2Tij/m) 1-0
Step by Step Solution
There are 3 Steps involved in it

Get step-by-step solutions from verified subject matter experts